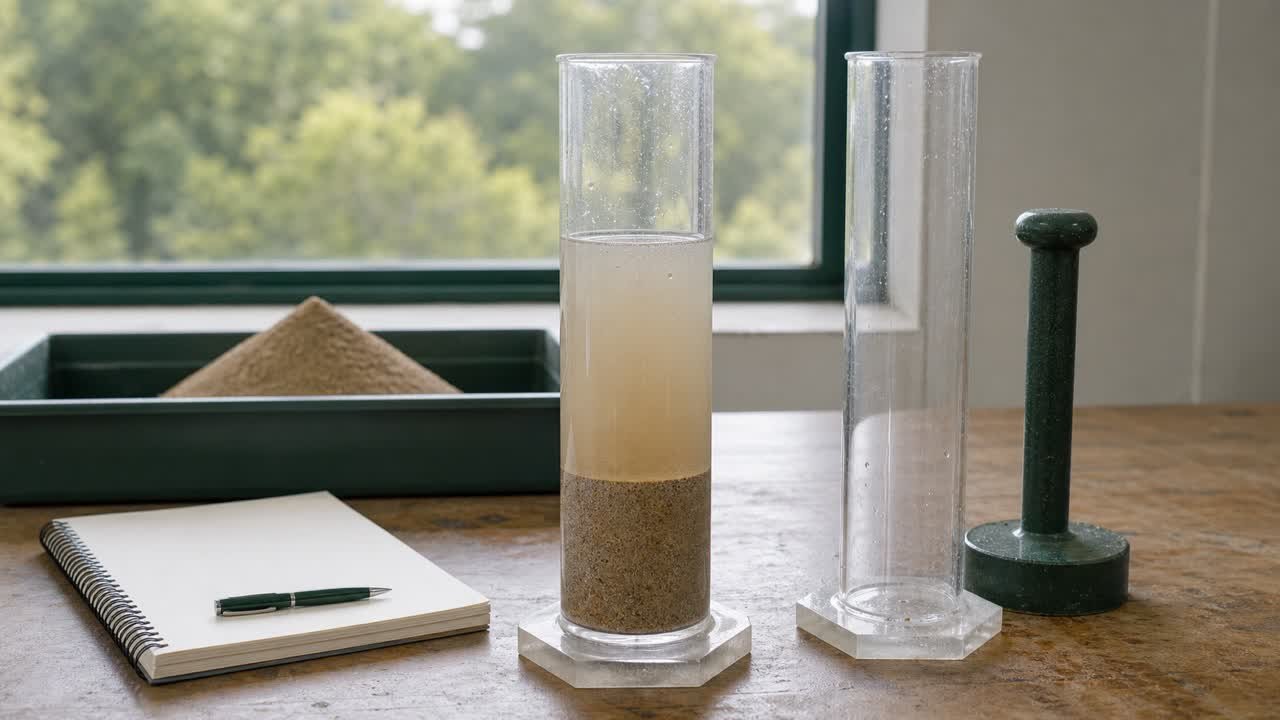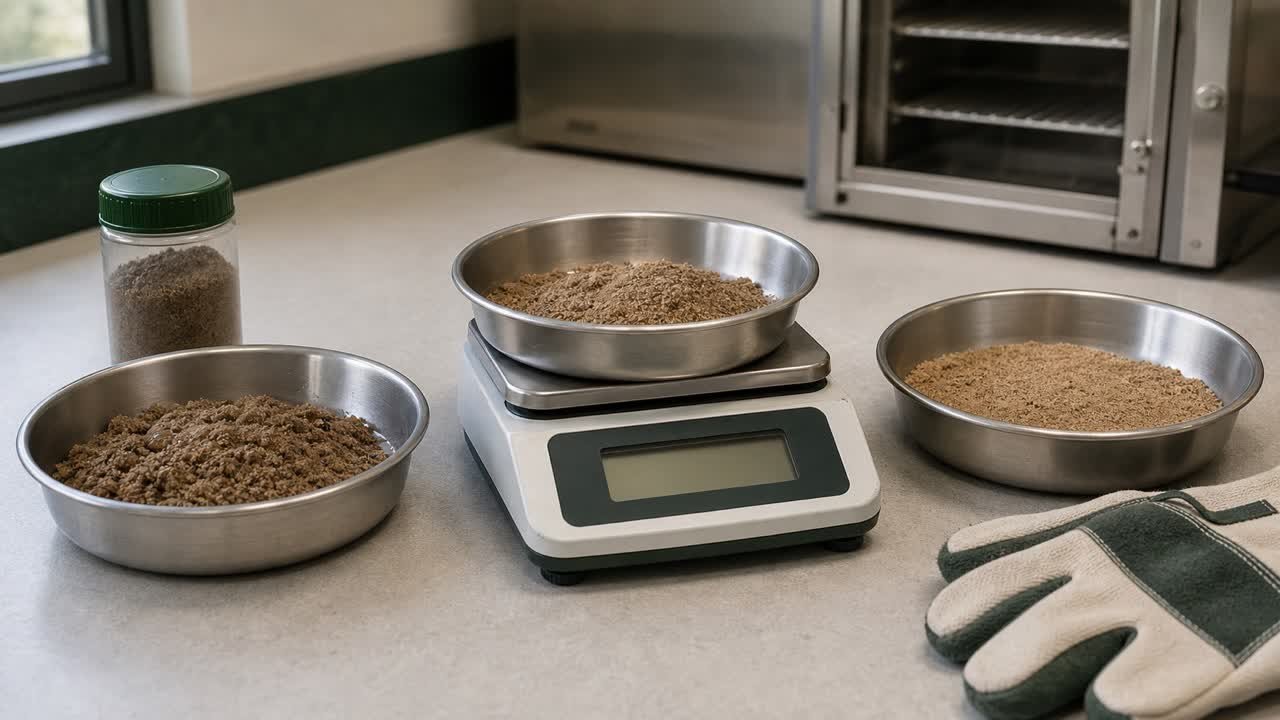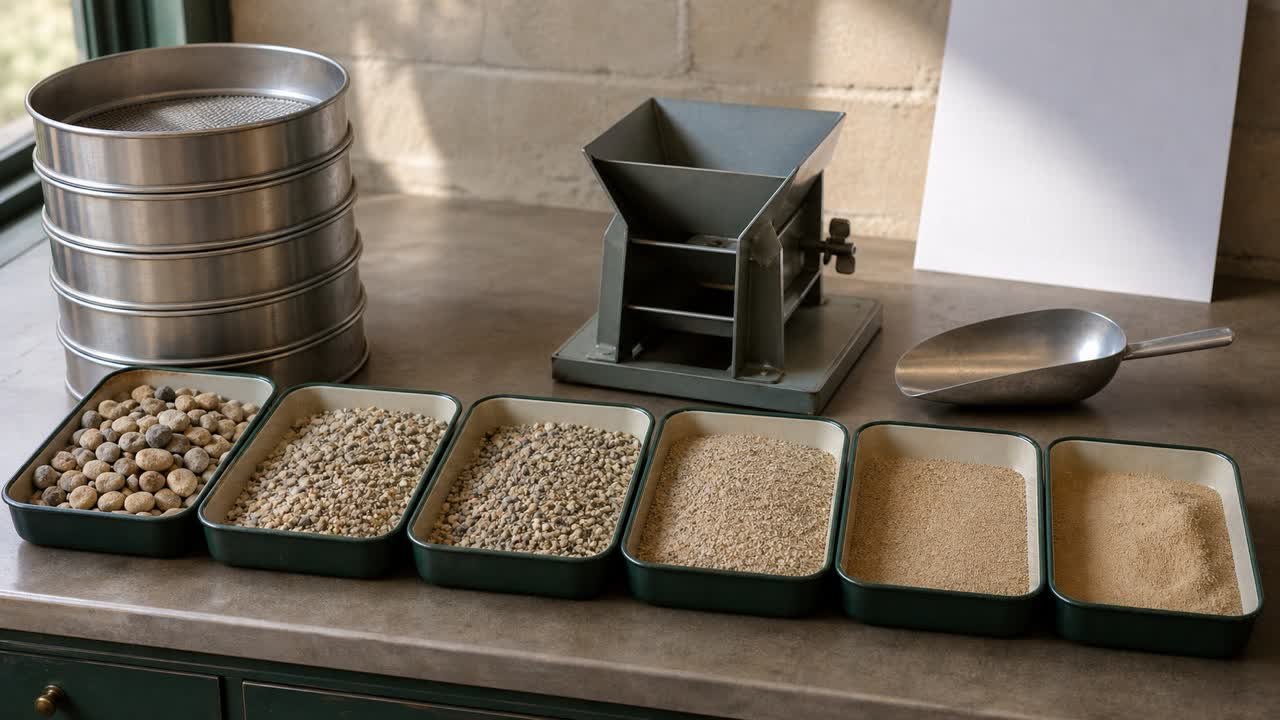
A fine-aggregate specific-gravity report uses 4 related masses to describe particle volume and water absorption. The calculation only works when the oven-dry sample, saturated-surface-dry sample and pycnometer readings belong to one compatible test record.
Start with the governing method and its revision. Then label each mass before entering an equation, keep the unrounded results, and compare the arithmetic checks with the laboratory record.
How do you calculate sand specific gravity and absorption?
Calculate the mass of water displaced by the saturated-surface-dry sample, then use that denominator for bulk oven-dry and bulk SSD relative density. A second denominator gives apparent relative density. Absorption compares the SSD and oven-dry masses.
Displaced-water mass, D = B + S - C
Bulk relative density (OD) = A ÷ D
Bulk relative density (SSD) = S ÷ D
Apparent relative density = A ÷ (B + A - C)
Absorption (%) = (S - A) ÷ A × 100
The specific-gravity results are dimensionless. Use the same mass unit for A, B, C and S.
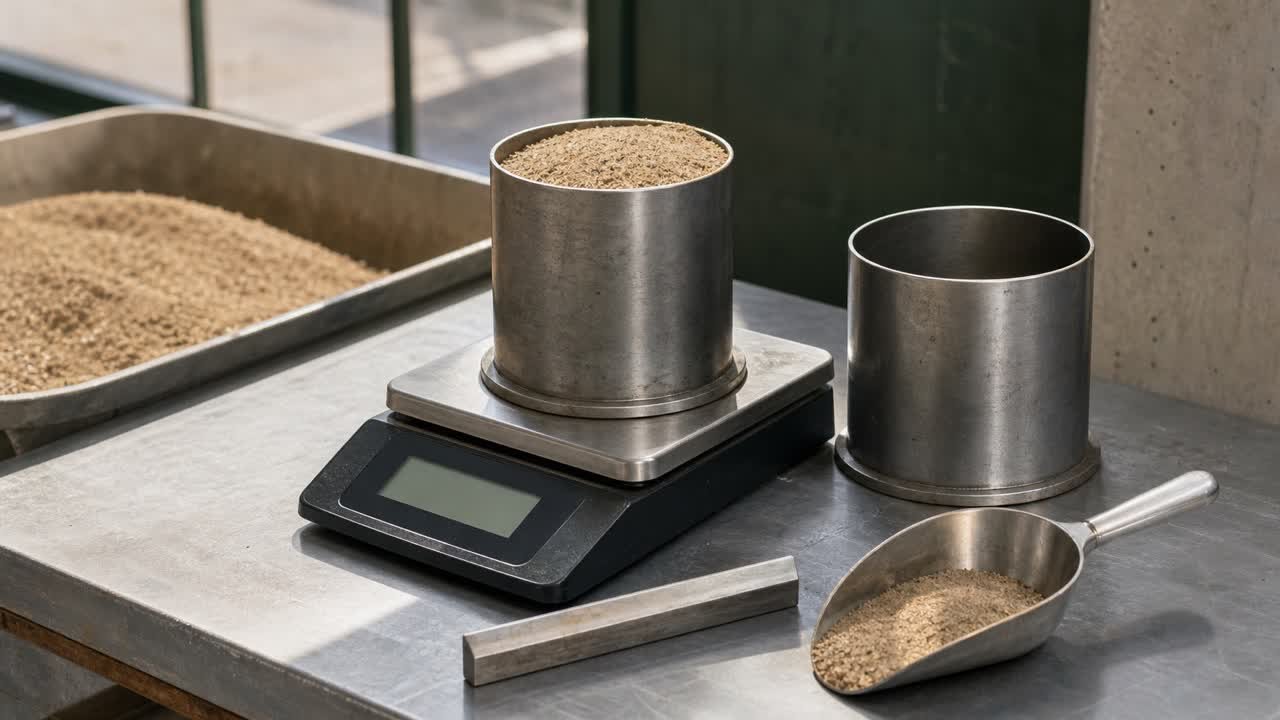
A and S describe aggregate in air. B and C include the same pycnometer filled to its calibrated capacity under the method's temperature controls.
What do A, B, C and S mean?
The symbols refer to measured masses, not interchangeable labels. Confirm the report's own notation because a laboratory may use different letters.
| Symbol | Mass | Main check |
|---|---|---|
| A | Oven-dry fine aggregate in air | Final dry mass under the stated method |
| B | Pycnometer filled with water to calibration | Correct pycnometer, water level and temperature basis |
| C | Pycnometer with SSD fine aggregate and water to calibration | Entrapped air removed and exterior dry |
| S | Saturated-surface-dry fine aggregate in air | Pores saturated and particle surfaces dry under the stated method |
The quantity B + S - C represents the mass of water displaced by the SSD aggregate volume. It must be greater than zero. A zero or negative denominator makes the calculation invalid.
Worked example: calculate all 4 reported results
Assume a compatible fine-aggregate test record contains these masses:
- A = 492.0 g oven-dry aggregate.
- B = 700.0 g pycnometer plus water.
- C = 1,010.0 g pycnometer plus SSD sample and water.
- S = 500.0 g SSD aggregate.
| Result | Calculation | Unrounded value | FDOT report precision |
|---|---|---|---|
| Displaced-water mass | 700 + 500 - 1,010 | 190.0 g | Input check |
| Bulk OD | 492 ÷ 190 | 2.589473684 | 2.589 |
| Bulk SSD | 500 ÷ 190 | 2.631578947 | 2.632 |
| Apparent | 492 ÷ (700 + 492 - 1,010) | 2.703296703 | 2.703 |
| Absorption | (500 - 492) ÷ 492 × 100 | 1.62601626% | 1.6% |
FDOT FM 1-T 084 reports specific gravity to 0.001 and absorption to 0.1%. Use the precision required by the method that governs the actual test.
The absorption reverse check returns the SSD mass:
492 × (1 + 1.62601626 ÷ 100) = 500.0 g
These values test the equations. They do not define an acceptable or typical sand.
Why does the pycnometer equation use B + S - C?
B establishes the mass of the water-filled pycnometer. Adding S predicts the combined mass before the aggregate displaces water. C is the measured mass after the SSD aggregate occupies part of the calibrated volume.
The difference B + S - C is therefore the mass of water displaced by the SSD aggregate volume. Bulk OD uses oven-dry aggregate mass over that SSD bulk-particle volume. Bulk SSD uses SSD mass over the same volume.
Apparent relative density changes the denominator to B + A - C. ASTM C128-25 explains that apparent relative density addresses the solid material and excludes pore space within the particles that water can reach.
How do bulk OD, bulk SSD and apparent specific gravity differ?
Each result uses a different particle mass or volume boundary. Select the result named by the mix calculation, specification or test report.
| Result | Mass basis | Volume boundary | Common use stated by ASTM C128 |
|---|---|---|---|
| Bulk OD | Oven-dry mass A | Bulk particle volume including water-permeable pores | Calculations when aggregate is dry or assumed dry |
| Bulk SSD | SSD mass S | Same bulk particle volume | Calculations when absorption has been satisfied |
| Apparent | Oven-dry mass A | Solid material excluding water-permeable pore space | A less common construction-aggregate result |
The fixture produces apparent 2.703, bulk SSD 2.632 and bulk OD 2.589. For a valid positive-absorption record under these equations, the ordering provides a useful arithmetic check. A different order calls for a review of symbols, masses, denominators, sample state and transcription.
Is specific gravity the same as sand bulk density?
Specific gravity compares aggregate-particle density with water density and has no unit. Bulk density relates mass to the total bulk volume occupied by many particles, including the spaces between them.
ASTM C128-25 separates particle relative density from bulk density determined under ASTM C29/C29M. A cubic-yard or cubic-metre order conversion needs a bulk density for the selected product and material condition. Substituting specific gravity would count the interparticle void space incorrectly.
The Sand Weight Chart uses documented bulk density for volume-to-mass work. This page checks particle-level relative density and absorption from a laboratory test.
How is saturated-surface-dry sand identified?
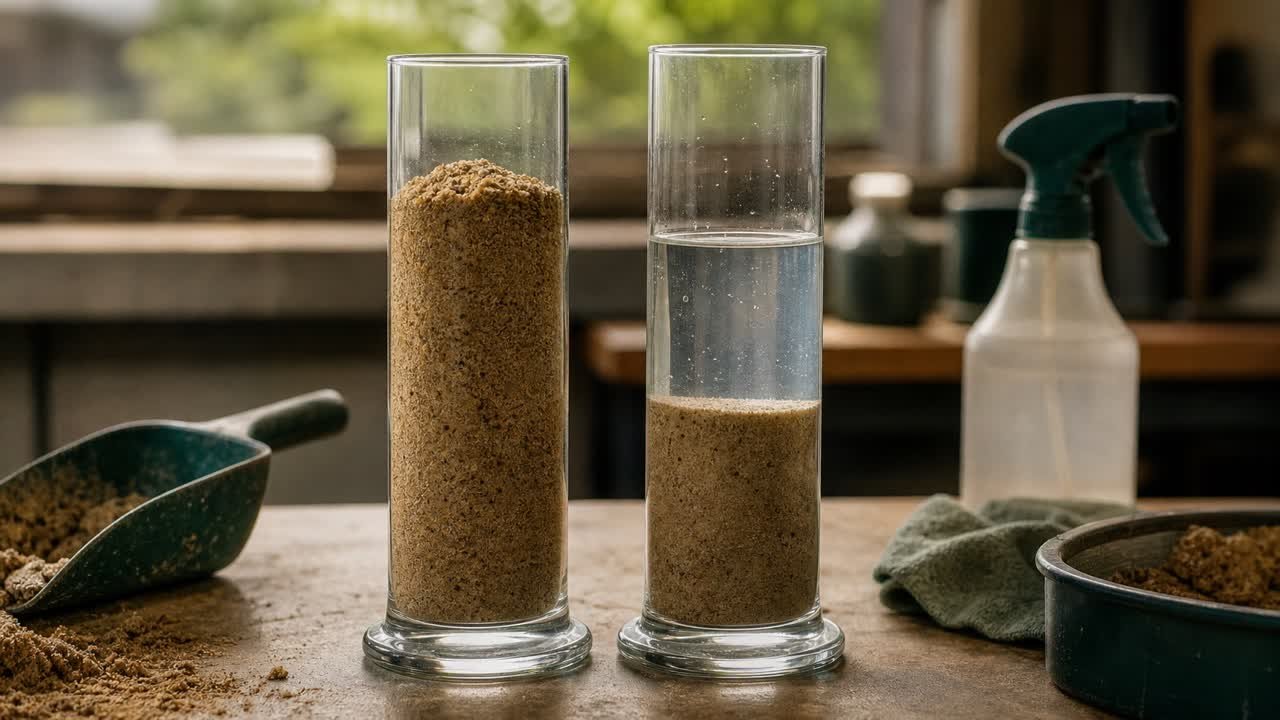
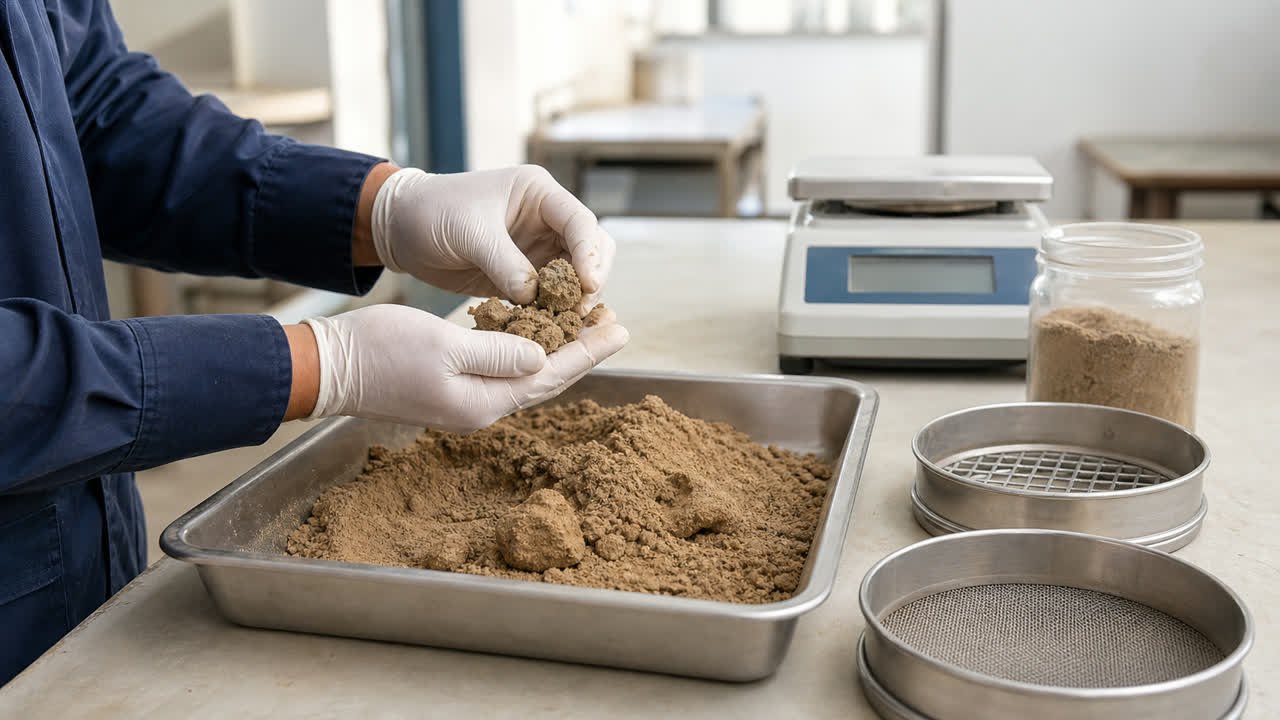
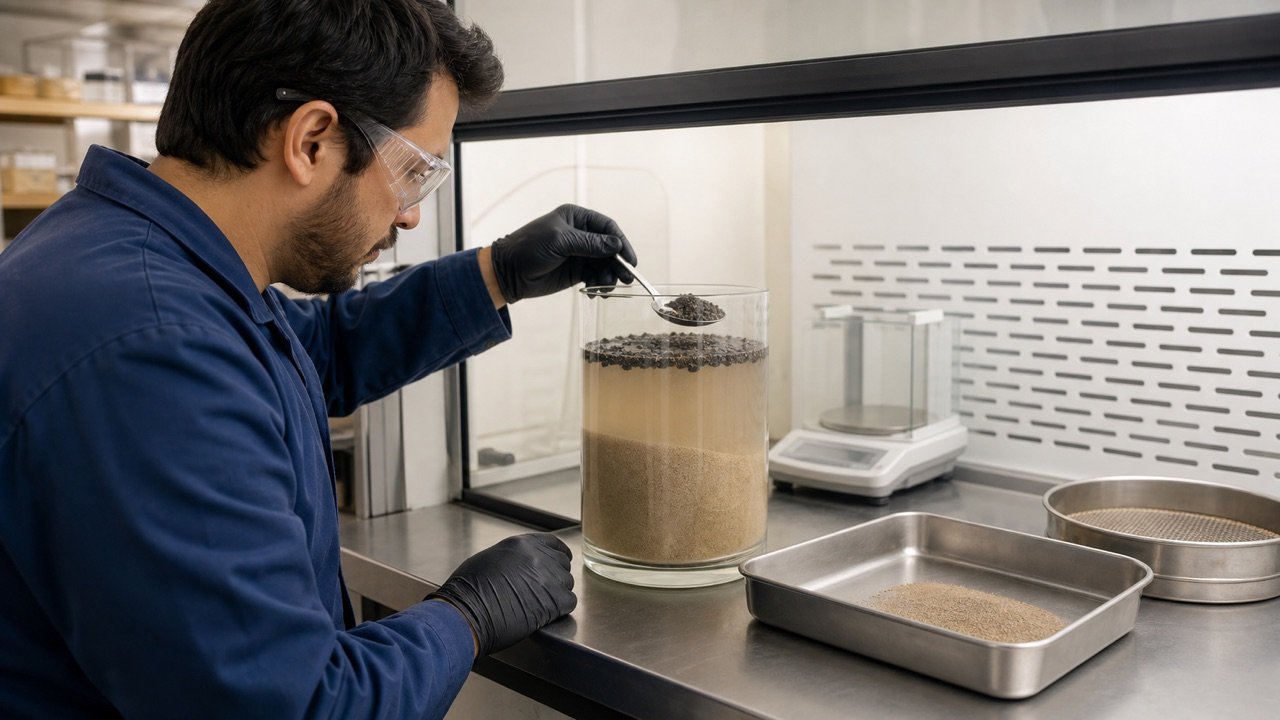
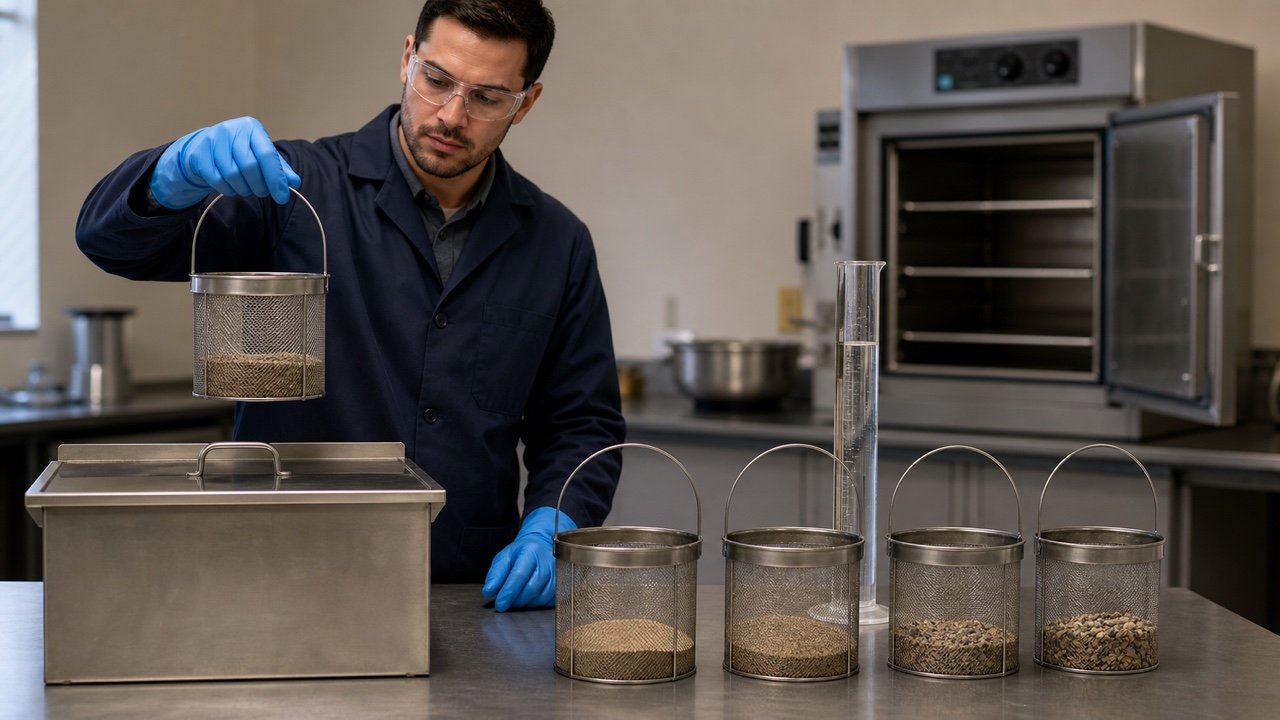
The selected test method defines the SSD preparation and endpoint. In the cited FDOT checklist, the technician dries a saturated sample with frequent stirring and uses a cone test. Sand that retains the molded shape still has surface moisture; a slight slump indicates the SSD condition under that procedure.
California Test 207 gives the same practical warning. If the cone slumps on the first trial, the technician may have dried the sample past SSD and must follow that method's reconditioning steps.
SSD timing affects both S and C. Evaporation after the endpoint can reduce the recorded SSD mass. Nonuniform drying can leave some particles too wet while others have lost absorbed water. Follow the complete method rather than using the short description as a laboratory procedure.
How do air bubbles and temperature affect the result?
Entrapped air changes C because the pycnometer no longer contains only the intended aggregate and water at its calibrated volume. The method controls agitation, filling, exterior drying and temperature to keep B and C comparable.
- Use the same calibrated pycnometer for the paired readings.
- Bring the liquid to the calibration mark without material loss.
- Remove entrapped air by the method's approved process.
- Keep the water and pycnometer readings within the required temperature conditions.
- Dry the outside before weighing C.
- Record masses at the balance resolution required by the method.
FDOT FM 1-T 084 adds Florida-specific apparatus and preparation provisions to AASHTO T 84. Those provisions do not transfer to a project using another method.
How is absorption related to sand moisture content?
Absorption measures the mass increase from oven-dry to SSD condition under the stated conditioning procedure. Total moisture measures evaporable water in the current sample. For wet aggregate, the difference between compatible total moisture and absorption estimates free surface moisture.
Surface moisture (%) = total moisture (%) - absorption (%)
Assume a representative current sand sample has 5.4% total moisture on a dry-mass basis and its approved absorption record is 1.6% on the same basis:
Surface moisture = 5.4% - 1.6% = 3.8%
This arithmetic illustration does not set a concrete batch-water change. The approved mix basis, current aggregate masses, all water sources and production procedure control that decision.
The Sand Moisture Content guide shows the wet and dry mass calculation and explains how the result connects to a concrete worksheet.
Second fixture: check a lower absorption result
A second record uses A = 496.5 g, B = 680.0 g, C = 990.0 g and S = 500.0 g.
| Result | Calculation | Unrounded value |
|---|---|---|
| Displaced-water mass | 680 + 500 - 990 | 190.0 g |
| Bulk OD | 496.5 ÷ 190 | 2.613157895 |
| Bulk SSD | 500 ÷ 190 | 2.631578947 |
| Apparent | 496.5 ÷ (680 + 496.5 - 990) | 2.662198391 |
| Absorption | 3.5 ÷ 496.5 × 100 | 0.704934542% |
The second fixture keeps the same displaced-water mass but changes A and the apparent denominator. It demonstrates why copying one reported specific gravity into every equation produces an inconsistent record.
Which arithmetic checks should you run before accepting the worksheet?
Run the checks before comparing results with a material specification. A clean calculation sheet can still contain mismatched masses.
| Check | Expected condition | Investigate when |
|---|---|---|
| SSD versus OD mass | S is at least A for a positive absorption result | S is below A or the difference conflicts with the reported absorption |
| Bulk denominator | B + S - C is greater than zero | Zero, negative or implausible for the apparatus and sample |
| Apparent denominator | B + A - C is greater than zero | Zero, negative or copied from the bulk denominator |
| Reverse absorption | A × (1 + absorption/100) returns S within rounding | The reconstructed SSD mass misses the recorded value |
| Result order | Apparent, bulk SSD and bulk OD follow the equation relationships for positive absorption | The order reverses without a documented cause |
| Traceability | All masses share sample, pycnometer, method and test conditions | IDs, dates, devices or method revisions differ |
These are calculation and record checks. The governing method sets repeatability, duplicate, averaging, acceptance and retest rules.
Can a typical specific-gravity range approve the sand?
No. A project specification, approved mix, source-control program or responsible reviewer sets acceptance requirements. A range from another aggregate type, quarry, jurisdiction or internet page cannot approve the tested material.
ASTM C128 describes how the results support absolute-volume calculations and aggregate records. It does not publish one passing specific gravity or absorption value for every fine aggregate use.
Compare the verified result with the exact product, source, sampling record, test method, project requirement and permitted variability. A source change or blended product can require a new decision even when the rounded result looks similar.
Common sand specific-gravity mistakes
- Using soil-specific-gravity equations for a fine-aggregate C128 or T 84 record.
- Swapping B and C because both include the pycnometer.
- Using A in the bulk denominator instead of S.
- Reporting bulk OD as bulk density in kg/m³ or lb/ft³.
- Calling damp sand SSD without the method's endpoint check.
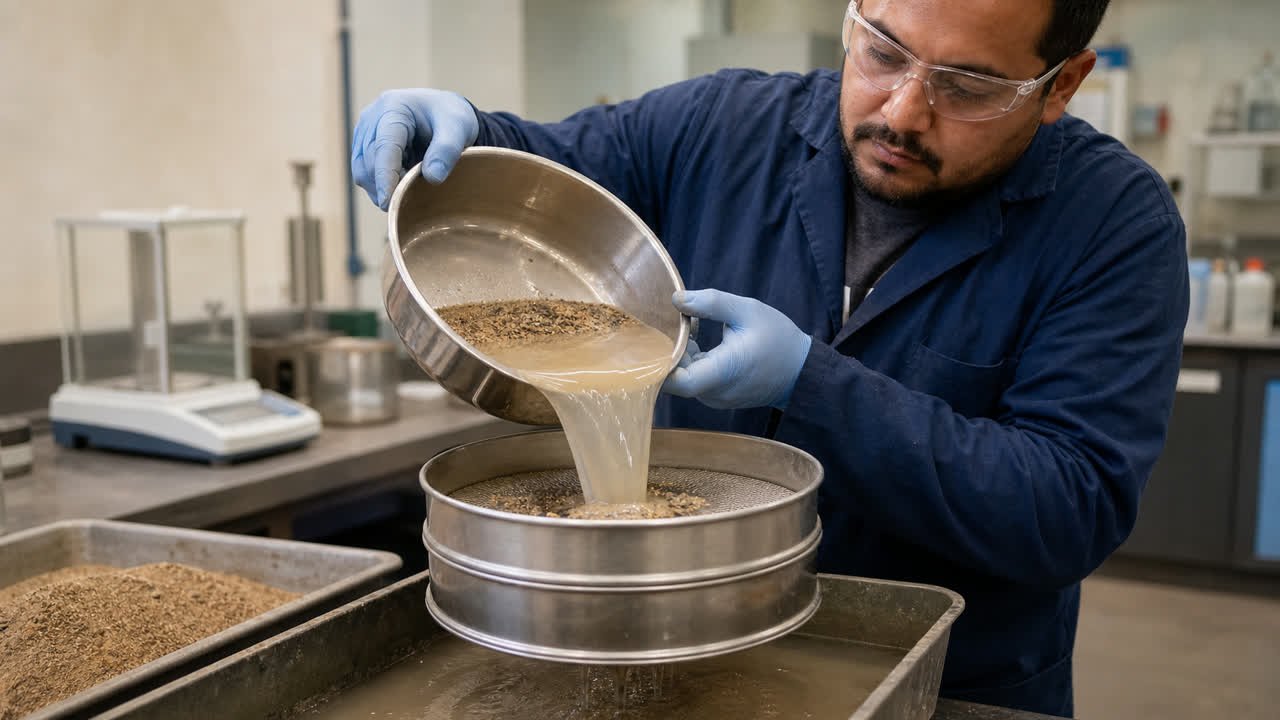
- Losing fines during soaking, decanting, transfer or flask filling.
- Leaving air bubbles in the pycnometer.
- Mixing water-only and sample-plus-water readings from different temperatures or pycnometers.
- Rounding A, B, C or S before calculating small mass differences.
- Using absorption as current total moisture.
- Subtracting absorption from moisture percentages that use different bases or samples.
- Using a typical range as a material acceptance limit.
What should the test record contain?
- Project, supplier, source, product, lot, sample ID and sampling date.
- Sampling and reduction methods with revisions.
- Specific-gravity method, revision and project modifications.
- Preparation, soak, SSD endpoint and constant-mass records required by the method.
- Pycnometer ID, calibration basis, water and test temperatures.
- Balance ID, resolution and calibration status.
- A, B, C and S with units and unrounded values.
- Both denominators, all 4 unrounded results and final reported precision.
- Technician, checker, deviations, duplicate results and disposition.
- Linked mix, source approval or specification decision made from the result.
Sources and source scope
- ASTM C128-25, Relative Density (Specific Gravity) and Absorption of Fine Aggregate: current scope, OD/SSD/apparent definitions, absolute-volume uses, bulk-density distinction, absorption conditioning and surface-moisture relationship. The complete paid standard controls ASTM testing.
- FDOT current Florida Sampling and Testing Methods list and FM 1-T 084: current Florida method listing and stated modifications to AASHTO T 84.
- FDOT FM 1-T084 procedure checklist: A, B, C and S equations plus procedural checkpoints within the published checklist.
- California Test 207: SSD cone behavior, immediate weighing, entrapped-air controls, absorption formula and safety scope under that California method.
- NRMCA TIP 6, Aggregate Moisture and Making Adjustments to Concrete Mixtures: OD, SSD and wet aggregate states plus concrete mixing-water context.
Scope: this page checks report definitions and arithmetic. The current complete test method, project documents, laboratory quality system, approved mixture, safety procedures and responsible qualified people control sampling, testing, acceptance and production.
Use the Sand Sampling guide to define what the specimen represents, return to the Sand Material Planning hub, or report a source, formula or rendering issue through the corrections route.