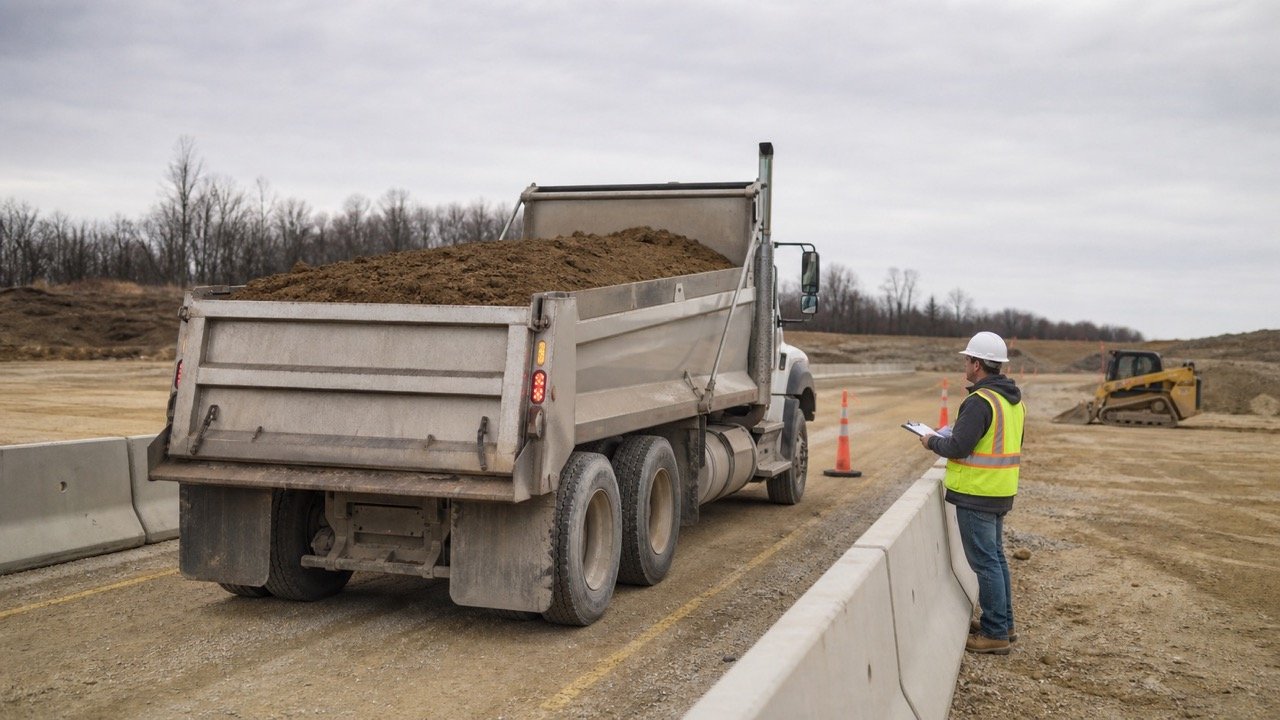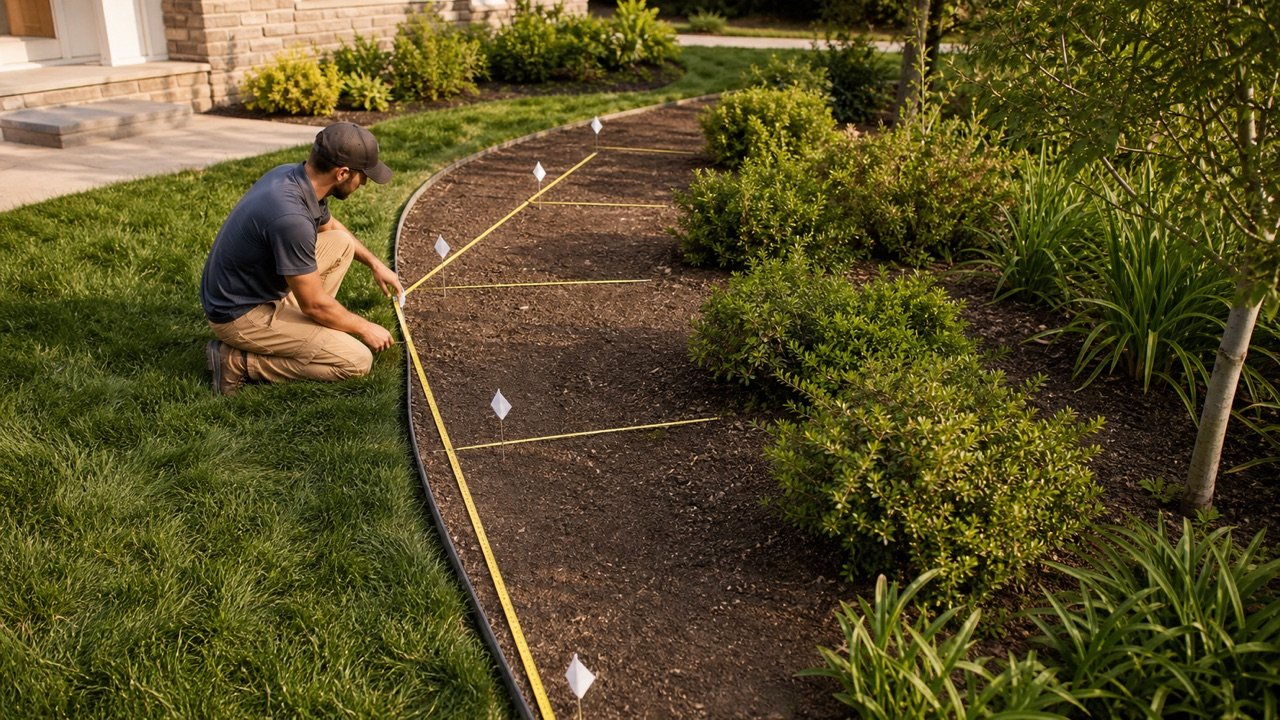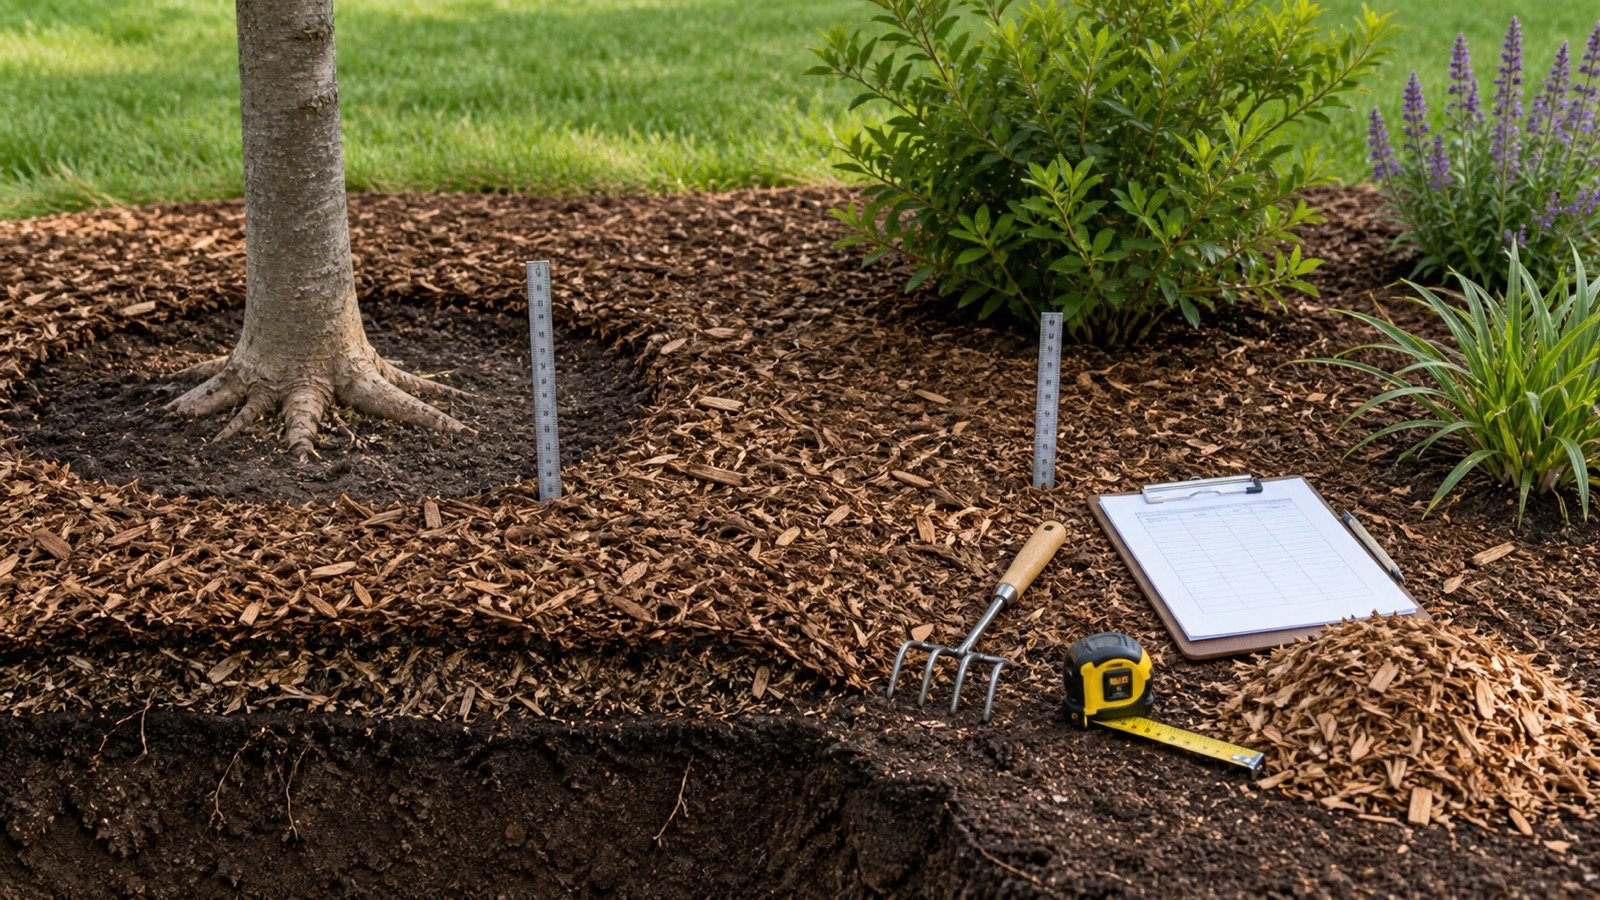
Cut and fill volume comes from the vertical difference between an accepted existing surface and the proposed earthwork surface inside a defined boundary. The result changes when the survey, design surface, boundary, interpolation or included layers change.
Record gross cut and gross fill separately. Their numerical difference is a geometric balance, not proof that excavated material is suitable, available or sufficient for compacted fill.
How do you calculate cut and fill volume?
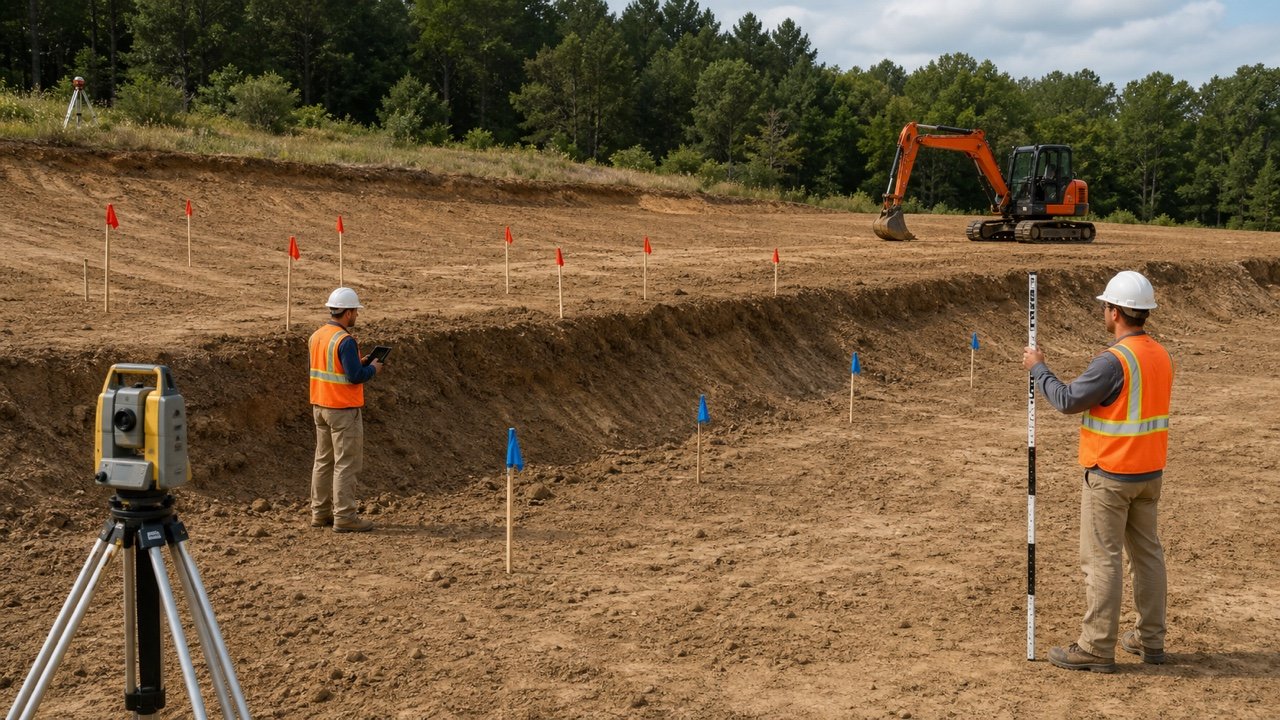
Compare existing and proposed elevations at enough points or sections to represent the terrain and design. Locate the zero-depth boundary, calculate cut and fill pieces, then add all unrounded cut volumes and all unrounded fill volumes separately.
Elevation difference, Δz = proposed elevation - existing elevation
Positive Δz = fill depth
Negative Δz = cut depth
Geometric net = gross cut - gross fill, reported with its sign convention
Some software and drawings use the opposite convention. Name the base and comparison surfaces, print the equation on the worksheet, and verify one known high point and one known low point before trusting a report.
Use the Fill Dirt Calculator for one uniform layer or one rectangular linear wedge. Use grids, cross-sections or a checked surface model when the terrain twists, changes direction or contains local cut and fill.
Which cut-and-fill method fits the site?
Choose the method from the geometry, available survey, required output and governing measurement rule. A more detailed tool cannot recover terrain or design features that were never measured.
| Condition | Possible method | Main QA question |
|---|---|---|
| Uniform layer or one linear wedge | Direct prism or wedge formula | Does the field surface actually match the simple geometry? |
| Broad site with spot levels | Grid cells or triangulated surface | Does spacing capture every grade break and local feature? |
| Road, ditch, trench corridor or other alignment | Cross-sections and the project volume rule | Are sections added at transitions and material changes? |
| Detailed topographic and design data | Existing-versus-proposed TIN or grid surfaces | Do boundaries, breaklines, units, datum and surface versions match? |
| Stockpile or excavation before-and-after survey | Two dated surfaces or approved stockpile method | Do both surveys represent the same boundary and control? |
| Concept estimate with sparse information | Simple zones with an uncertainty record | Is the result clearly labelled as screening rather than final quantity? |
Wyoming DOT's survey manual uses cross-sections and average end areas for its earthwork workflow. FHWA's current OpenRoads manual documents a software-based cross-section quantity process. These examples show valid methods in their scopes; they do not make one method mandatory for every project.
What information is needed before measuring earthwork?
Freeze the quantity boundary and identify what each surface represents. Finished pavement, top of subgrade, stripped ground and top of compacted fill are different design surfaces.
- Project boundary, exclusions, coordinate reference, horizontal units, vertical datum and elevation units.
- Existing survey source, date, point density, breaklines, water conditions and changes since survey.
- Proposed earthwork surface, revision, layer represented, tie-ins, walls, structures and drainage features.
- Topsoil stripping, demolition, unsuitable material, rock, undercut, over-excavation and replacement limits.
- Required method, interpolation, section spacing, grid treatment, rounding and acceptance record.
- Cut and fill material classes, state definitions, test or specification requirements and reuse decisions.
Caltrans instructs project staff to verify planned ground surfaces and to field-check terrain changes that could affect earthwork quantities. A clean model based on an old or incomplete surface remains a clean calculation of the wrong ground.
How does the grid method work?
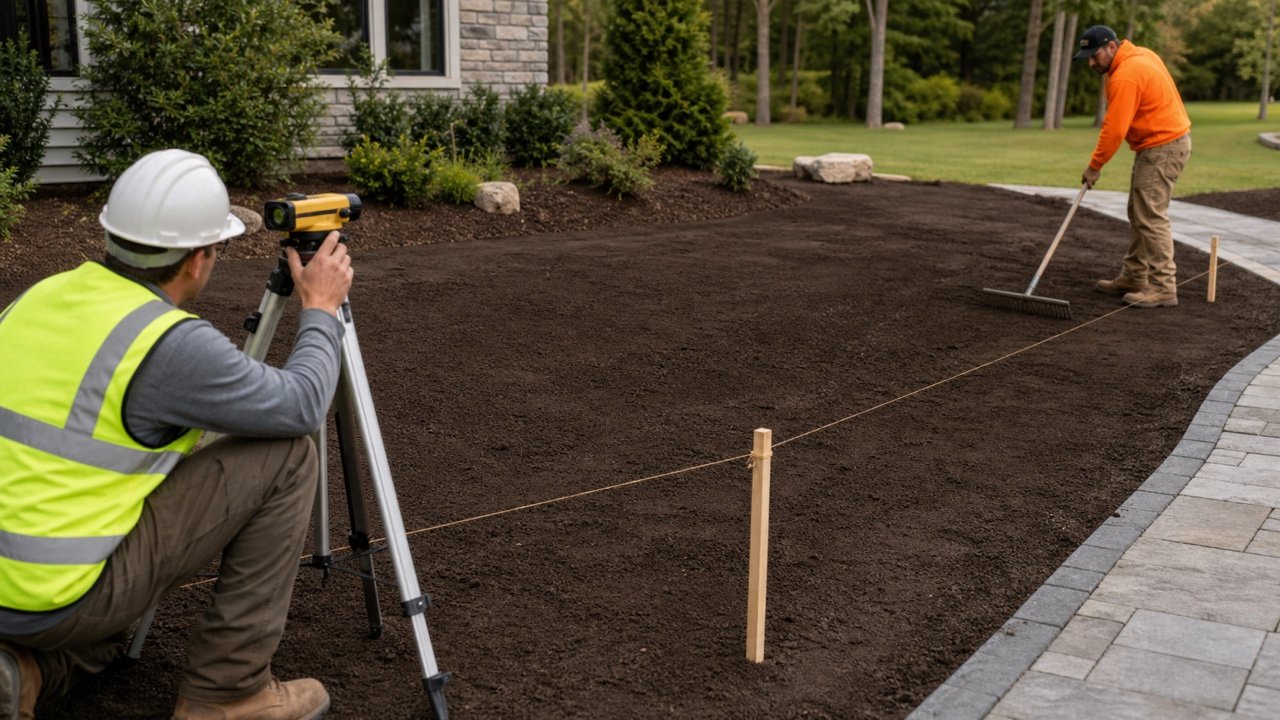
Divide the horizontal boundary into cells, record existing and proposed elevations at each node, and calculate Δz. For a cell wholly in cut or wholly in fill under the selected interpolation, multiply cell area by the mean absolute corner depth.
Mean cell depth = (|d1| + |d2| + |d3| + |d4|) ÷ 4
Cell volume = actual cell plan area × mean cell depth
- Clip edge cells to the real quantity boundary.
- Add nodes and breaklines at abrupt slope, wall, ditch, pad, terrace and drainage changes.
- Confirm every corner in a cell has the same sign before using one cut or fill volume.
- Split mixed-sign cells at the interpolated zero-depth line or use a surface method that preserves the boundary.
- Add gross cut cells and gross fill cells separately.
- Keep unrounded cell results for the total and audit trail.
There is no universal grid spacing. The appropriate density depends on terrain variability, design detail, required accuracy, survey method, risk and the governing specification. Test a tighter grid or independent method in areas where the result is sensitive.
Why can a mixed grid cell show a false zero?
Signed averaging can cancel cut against fill inside one cell. The net may be zero while material must still be excavated from one side and placed on the other.
A 10 m by 10 m cell has Δz values +0.4, +0.4, -0.4 and -0.4 m. A linear zero-depth line crosses the centre.
| Calculation | Result | Meaning |
|---|---|---|
| Signed corner average | (0.4 + 0.4 - 0.4 - 0.4) ÷ 4 = 0 | False zero if used as the only volume |
| Fill half | 50 m² × 0.2 m | 10 m³ gross fill |
| Cut half | 50 m² × 0.2 m | 10 m³ gross cut |
| Geometric net | 10 - 10 | 0 m³, while both operations still exist |
This fixture assumes a linear transition and two triangular depth prisms. If the zero line, terrain or proposed surface is not linear, subdivide further or use the project's checked surface method.
Worked imperial grid-cell example
A 20 ft by 20 ft cell is wholly in fill. Its corner fill depths are 0.50, 0.75, 1.00 and 1.25 ft.
| Stage | Calculation | Result |
|---|---|---|
| Plan area | 20 × 20 | 400 ft² |
| Mean fill depth | (0.50 + 0.75 + 1.00 + 1.25) ÷ 4 | 0.875 ft |
| Fill volume | 400 × 0.875 | 350 ft³ |
| Cubic yards | 350 ÷ 27 | 12.962963 yd³ fill |
The fixture checks arithmetic for a selected cell interpolation. It does not set grid spacing or confirm that 4 corners adequately represent the site.
How does the cross-section method work?
At each station, plot existing and proposed profiles and calculate separate cut and fill areas. Apply the governing volume formula between adjacent sections, then sum the interval quantities.
Average end area volume = (A1 + A2) ÷ 2 × L
Two fill sections have areas 40 and 70 m² and are 25 m apart. The average-end-area result is:
V = (40 + 70) ÷ 2 × 25 = 1,375 m³ fill
Wyoming DOT states that average end area is exact when the two end areas are equal and approximate when they differ. Add sections where geometry changes sharply rather than assuming one long interpolation represents a transition.
What happens when one end area is zero?
The ordinary average-end-area formula can misrepresent a wedge that closes to a point. Wyoming DOT shows a pyramidal formula for its zero-end-area case.
Pyramidal zero-end volume = A × L ÷ 3
| Method | Calculation | Result |
|---|---|---|
| Ordinary average end area | (40 + 0) ÷ 2 × 25 | 500 m³ |
| Pyramidal case | 40 × 25 ÷ 3 | 333.333333 m³ |
| Difference | 500 - 333.333333 | 166.666667 m³ |
The correct treatment depends on the actual geometry and governing method. Record the transition shape instead of choosing the smaller result by preference.
How do surface-to-surface calculations work?
A surface method compares two elevation models over the same horizontal boundary. Software subdivides the difference into cells or prisms, then totals positive and negative volumes under its documented algorithm.
Before accepting the result, check:
- Existing surface name, source files, survey date and excluded bad points.
- Proposed surface name, revision and whether it represents earthwork subgrade or another layer.
- Coordinate reference, horizontal units, vertical datum, elevation units and scale.
- Outer boundary, holes, non-grading areas and overlap between surfaces.
- Breaklines at ridges, toes, tops, curbs, walls, ditches and other discontinuities.
- Triangles or cells that bridge across buildings, water, missing data or vertical faces.
- Cut/fill sign, gross volumes, net volume and software rounding settings.
- An independent spot, grid, section or simple-volume check in known areas.
A high-density surface can repeat a wrong breakline or wrong datum more precisely. Inspect the cut/fill map and extreme depth locations, not only the final total.
Why can grid, section and surface results differ?
They may use different samples, interpolation, boundaries, layers and transition assumptions. First align those inputs, then compare the methods.
| Difference source | Check |
|---|---|
| Boundary | Confirm identical grading limits, exclusions and partial cells |
| Surface layer | Confirm both results compare existing ground with the same proposed earthwork surface |
| Sampling | Add points, cells or sections at missed grade breaks and local features |
| Interpolation | Compare grid averaging, section rule and TIN breakline treatment |
| Mixed cut and fill | Confirm gross quantities were partitioned at zero rather than netted inside cells or sections |
| Units and datum | Check horizontal and vertical units, coordinate system and benchmark |
| Rounding | Use unrounded components and compare at the same final precision |
| Version | Match survey, design, undercut and field-change revisions |
Document an acceptable comparison tolerance for the project. A percentage alone can be misleading when the net is near zero but gross cut and fill are both large.
Does equal cut and fill mean no imported dirt is needed?
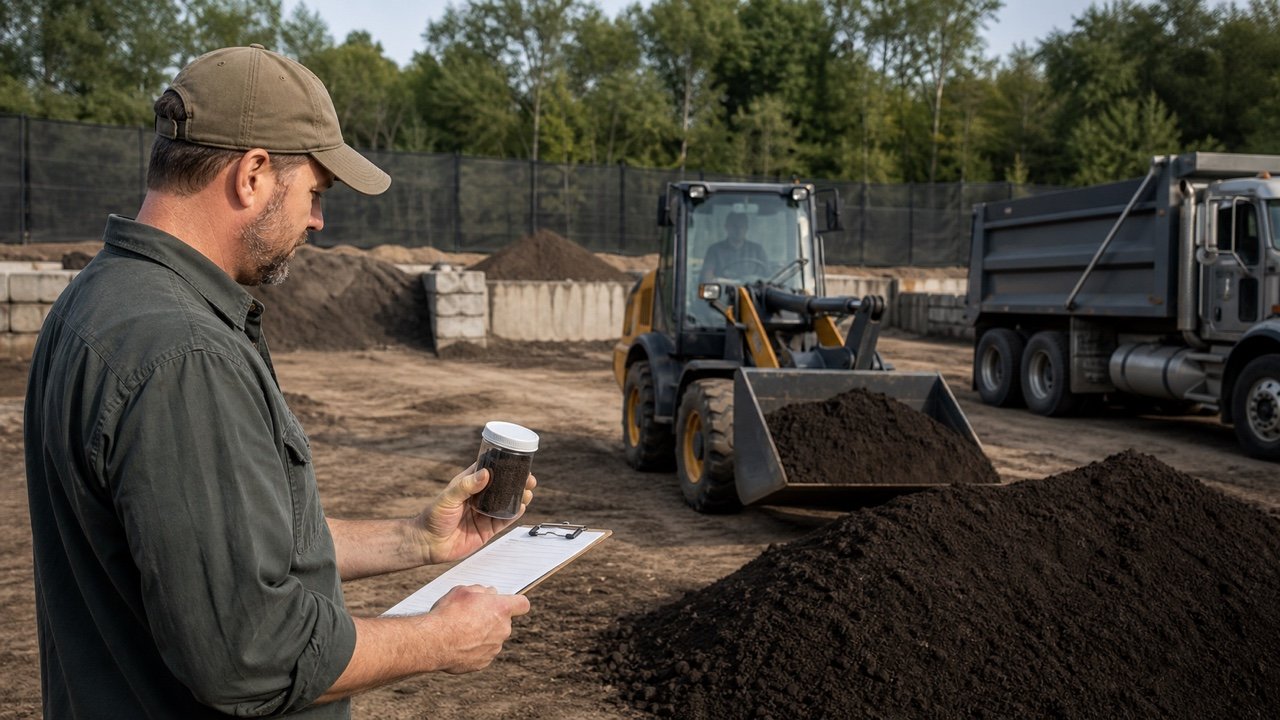
No. Equal geometric volumes do not establish a material balance. Cut may include topsoil, unsuitable soil, rock, wet material, contaminated material, demolition, oversized particles or material reserved for another use.
Fill demand may be a compacted or accepted in-place volume. Excavated cut is normally measured in bank state, while a stockpile or truck holds loose material. Apply supported material-specific bank, loose and compacted relationships only after classification and acceptance.
- Subtract stripping and excluded material from the available cut source.
- Separate reusable material classes and their approved destinations.
- Record processing, moisture conditioning, oversize removal and expected losses.
- Convert each material between states with its own documented factor.
- Keep borrow, export, temporary stockpile and haul distance as later planning records.
The Bank vs Loose Volume guide explains material states. The Topsoil Depth Guide helps record stripped and replacement topsoil as a separate landscape layer.
How should topsoil, pavement and structures be handled?
Model the surface that the earthwork quantity is meant to reach. Add or deduct other layers explicitly rather than shifting the whole proposed surface without a record.
| Item | Quantity treatment |
|---|---|
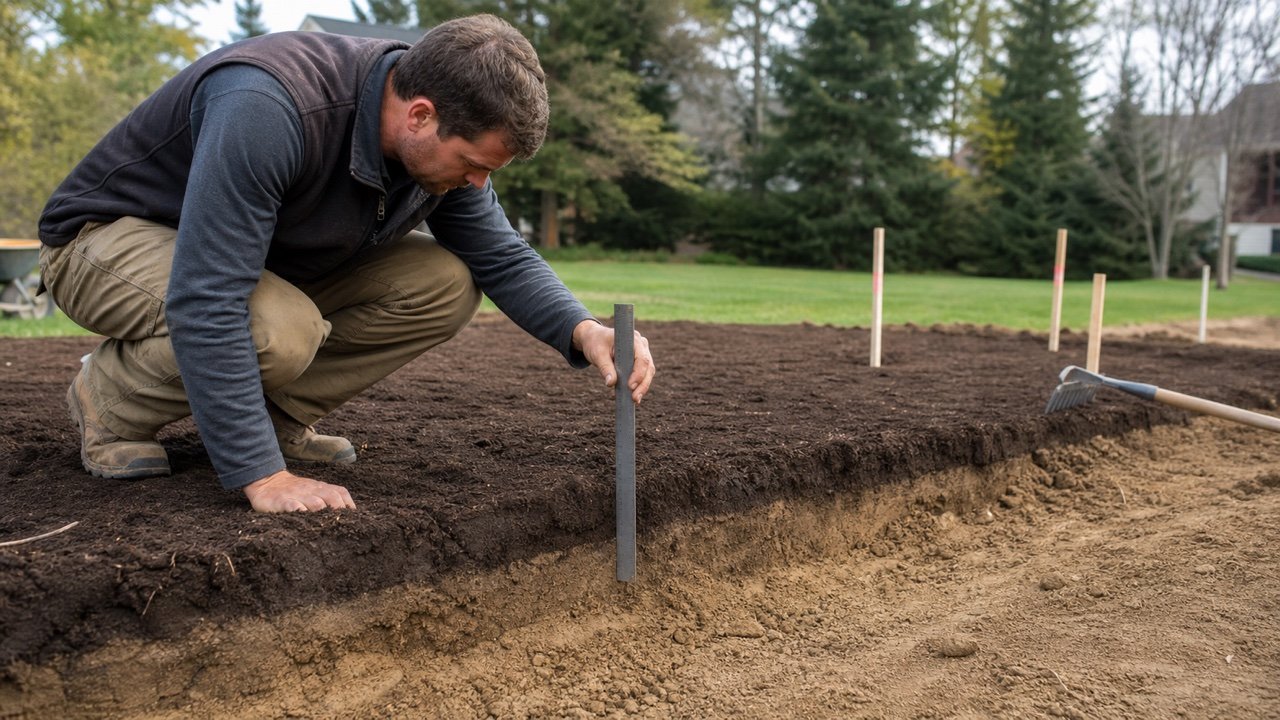
| Topsoil strip | Separate bank stripping volume, stockpile and replacement requirement |
| Pavement and aggregate layers | Use earthwork subgrade rather than finished pavement surface, then measure pavement layers separately |
| Buildings and structures | Clip or model excavation, backfill and displacement under their own details |
| Utilities and trenches | Use trench-specific geometry, bedding, pipe and backfill deductions |
| Retaining walls | Model defined excavation and fill limits; do not bridge a TIN across a vertical face |
| Undercut and over-excavation | Add approved field-change volumes by date and material class |
Use the Trench Excavation Calculator for simple trench bank geometry. Large, irregular or safety-critical excavation requires the project's survey, design and protective-system workflow.
How should quantity changes be recorded?
Keep a baseline and calculate versioned deltas. Do not overwrite the tender surface with an as-built surface and lose the reason for the change.
- Archive the original survey, design surface, boundary and quantity report.
- Assign revision IDs and dates to every accepted input.
- Map design changes, undercut, over-excavation, unsuitable material, rock and field instructions separately.
- Calculate gross cut and fill delta for each approved change.
- Reconcile survey quantities with tickets, tests, stockpiles and accepted installed work.
- Preserve unresolved differences and the person responsible for the decision.
FHWA's Earthwork Representation Guide uses grading summaries and mass-haul information to make earthwork components visible. A small-site ledger can follow the same principle without copying federal pay items that do not apply.
Common cut-and-fill measurement mistakes
- Using one average site elevation that nets local cut and fill before they are measured.
- Changing the sign convention between the field sheet, spreadsheet and software.
- Averaging mixed-sign grid corners into a zero-volume cell.
- Using full cell area along an irregular boundary.
- Choosing a grid or section spacing without checking grade breaks and local features.
- Applying ordinary average end area at a zero-area transition without checking geometry and the project method.
- Comparing finished pavement with existing ground when the required quantity is to subgrade.
- Ignoring topsoil strip, unsuitable material, rock, structures, utilities and undercut.
- Calling bank cut and compacted fill cubic units interchangeable.
- Assuming balanced geometry eliminates import, export, processing or haul.
- Trusting software totals without surface, boundary, unit, datum and extreme-depth checks.
- Rounding every cell or interval before gross totals are complete.
- Replacing the baseline instead of recording approved quantity changes.
What should the cut-and-fill record contain?
- Project, quantity purpose, preparer, checker, date and governing method.
- Existing survey source, date, control, units, datum, point and breakline checks.
- Proposed surface name, revision, represented layer, boundary and exclusions.
- Sign convention, zero-depth treatment and cut/fill map.
- Grid cells, sections or model settings with unrounded calculations.
- Gross bank cut and gross geometric fill by area and material class where known.
- Topsoil, demolition, rock, unsuitable material, structures, utilities and undercut adjustments.
- Material suitability, bank-loose-compacted factors, processing and loss records kept outside the base geometry.
- Independent check, discrepancy review, approved changes and final quantity status.
Return to the Landscaping Planning hub for the fill dirt, topsoil, compost and mulch tools used after the site geometry and material roles are defined.
Sources and source scope
- FHWA Central Federal Lands, Earthwork Representation: Grading Summaries & Mass Haul Diagrams: earthwork component, adjustment and plan-representation context.
- Wyoming DOT Survey Manual, Appendix F: cross-section, average-end-area and zero-end pyramidal formulas within its survey scope.
- Caltrans Construction Manual, Section 4-19 Earthwork and Section 3-5 Control of Work: verified ground, authorized cross-sections, average-area quantity and changed-terrain checks.
- FHWA Central Federal Lands, OpenRoads Designer Manual 20: Quantities: current cross-section and quantity-report software workflow.
- NIST Guide to the SI, Appendix B: unit relationships used in the examples.
Source scope: the transportation sources document methods and controls for their agencies and projects. They do not set a universal grid spacing, survey accuracy, material factor, pay rule or residential design. The worked points, cells and section areas are hypothetical arithmetic fixtures.