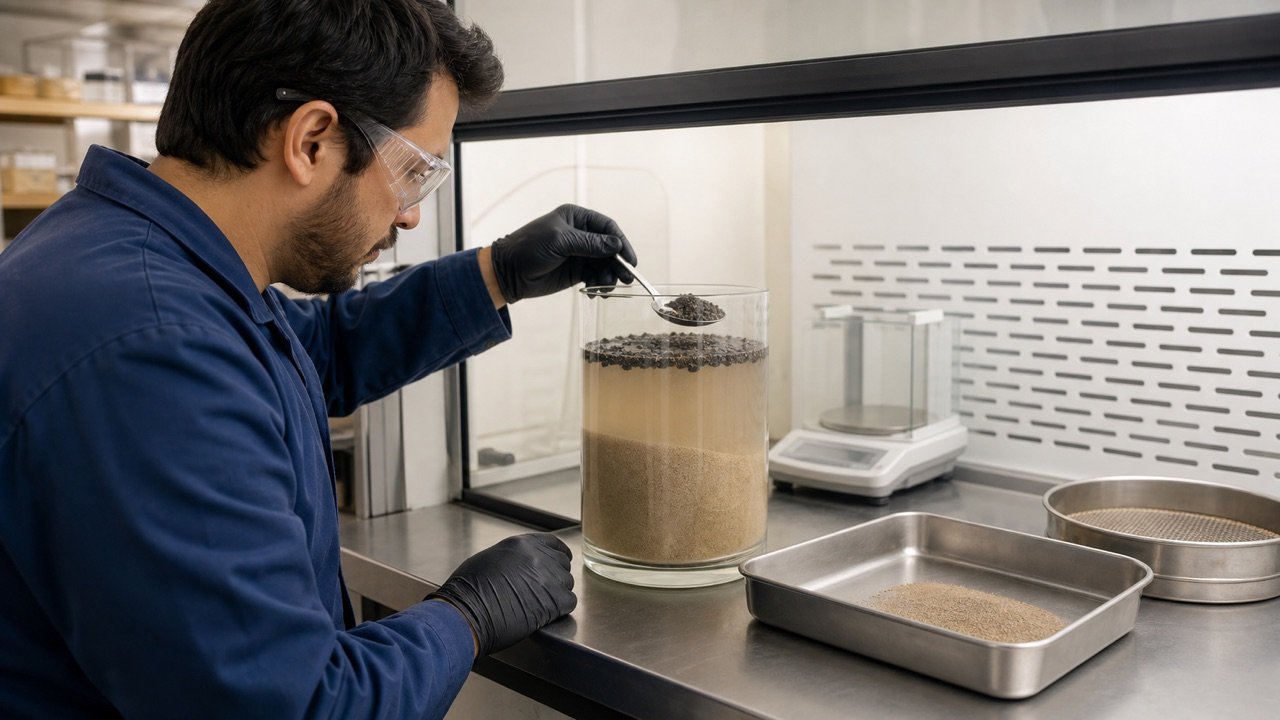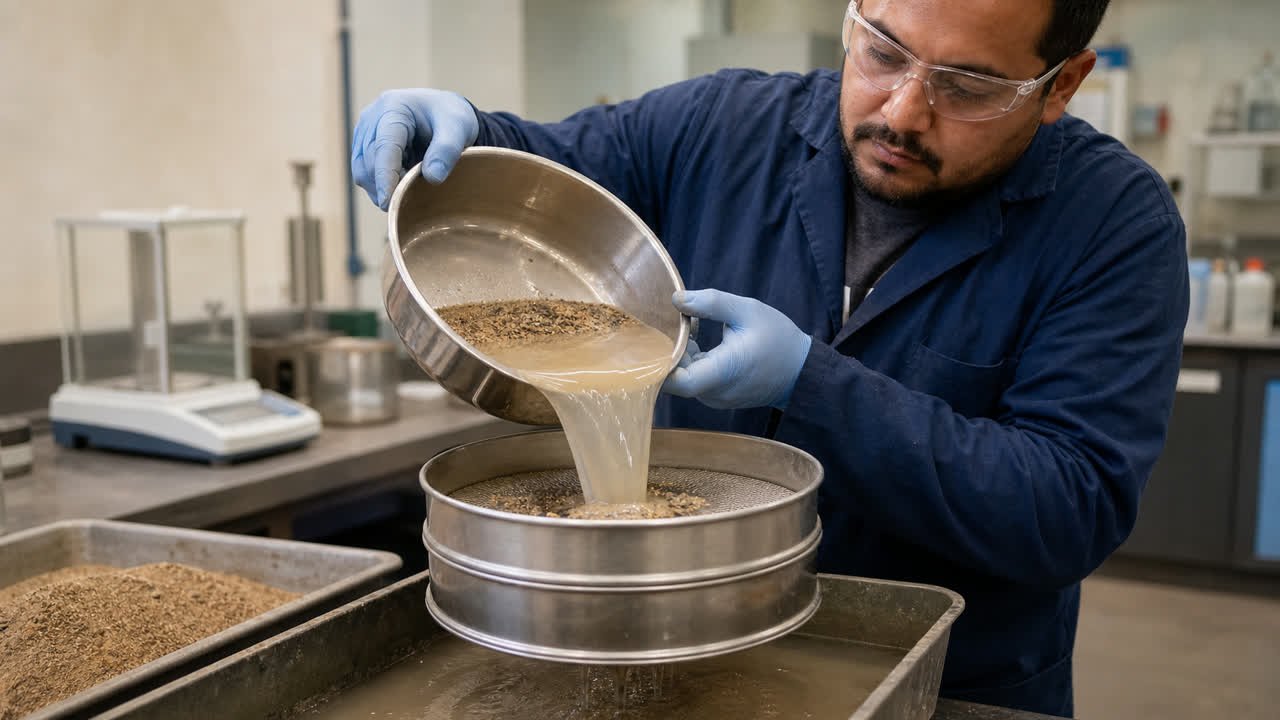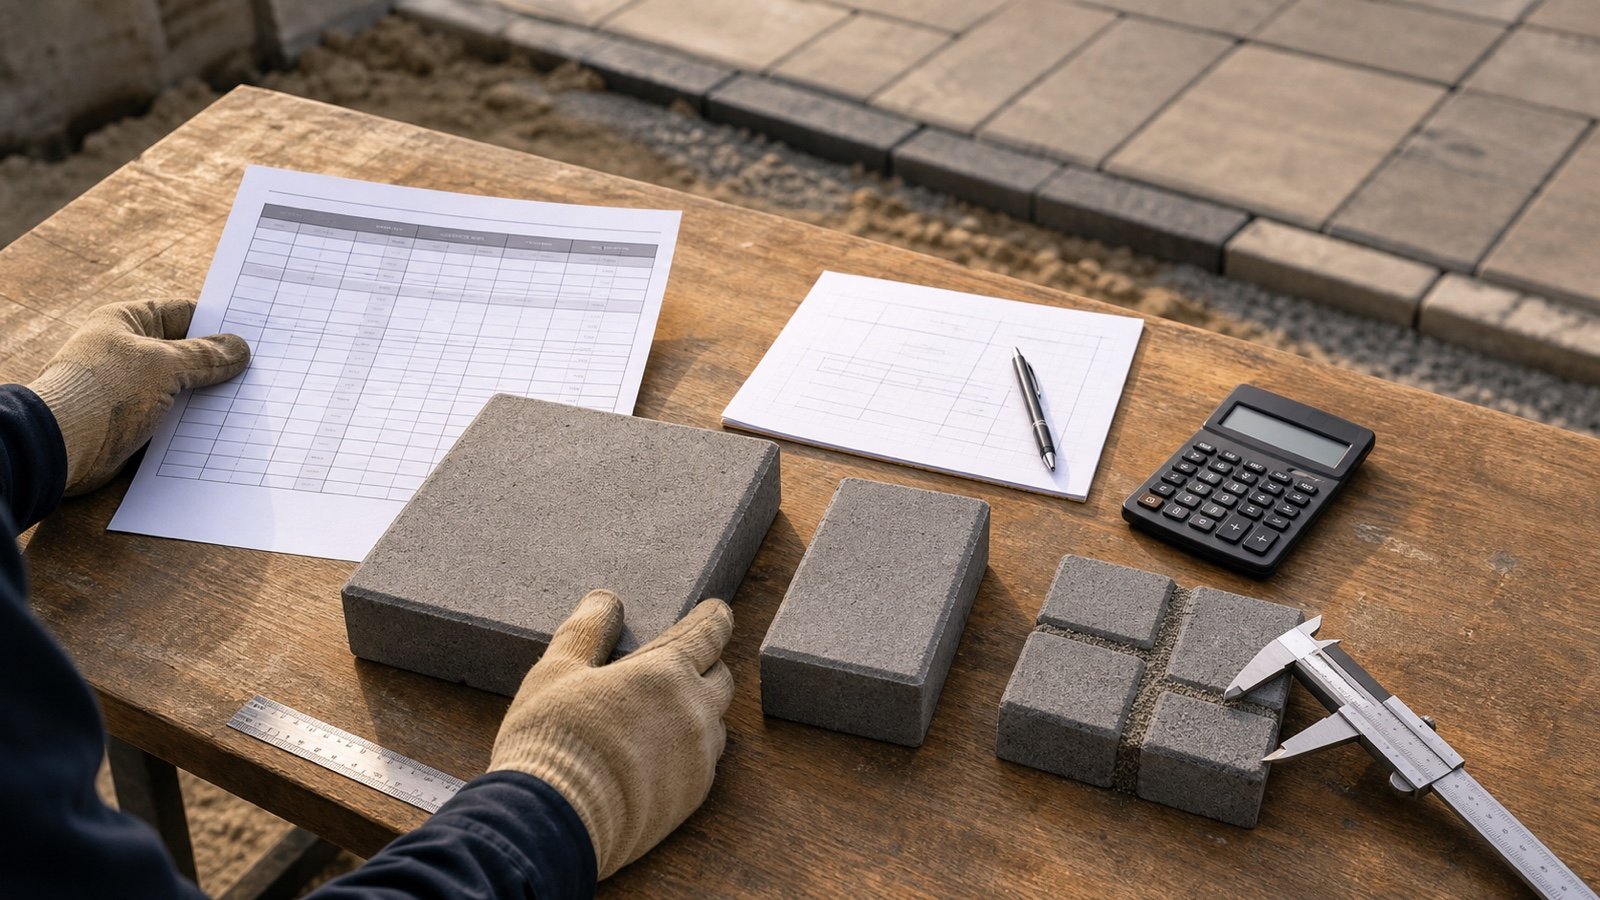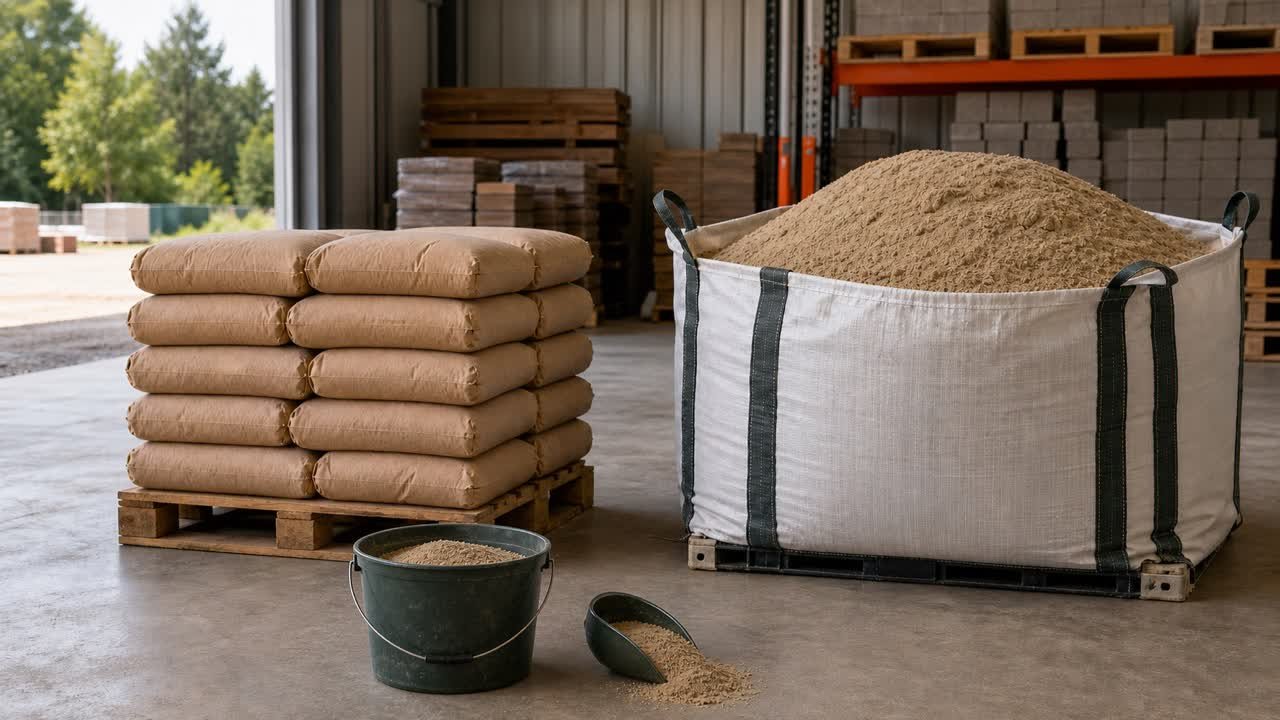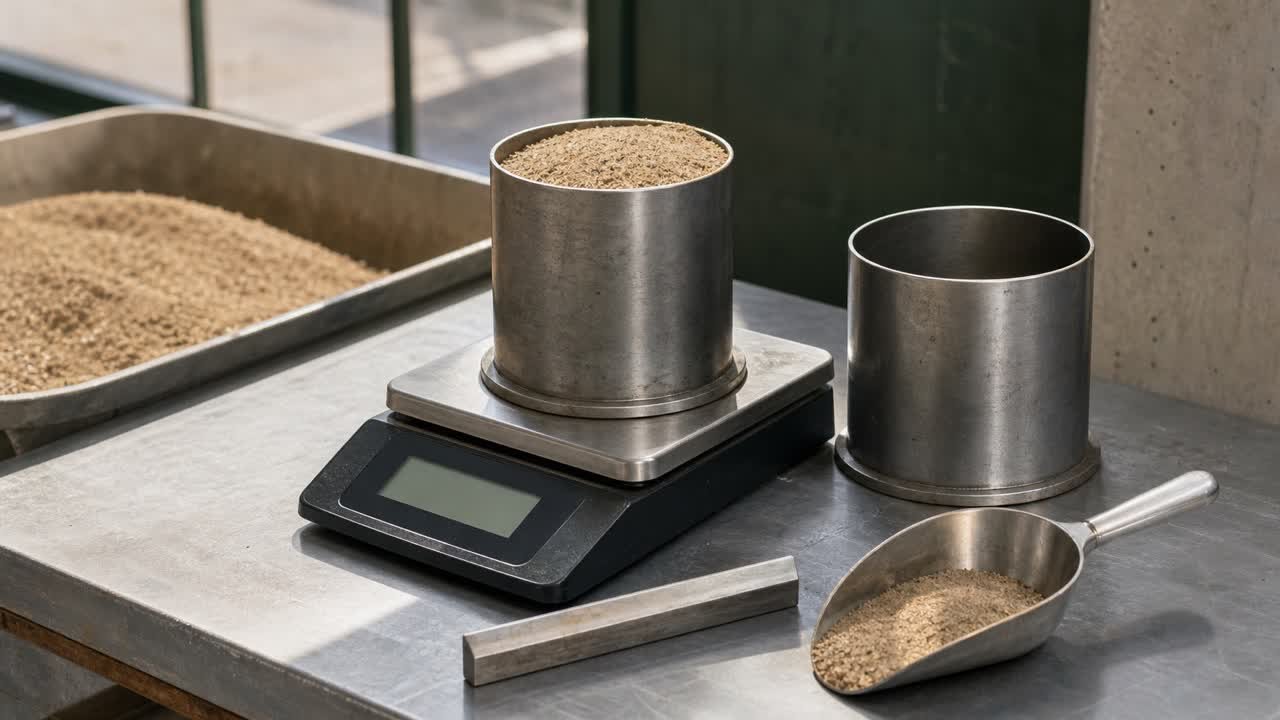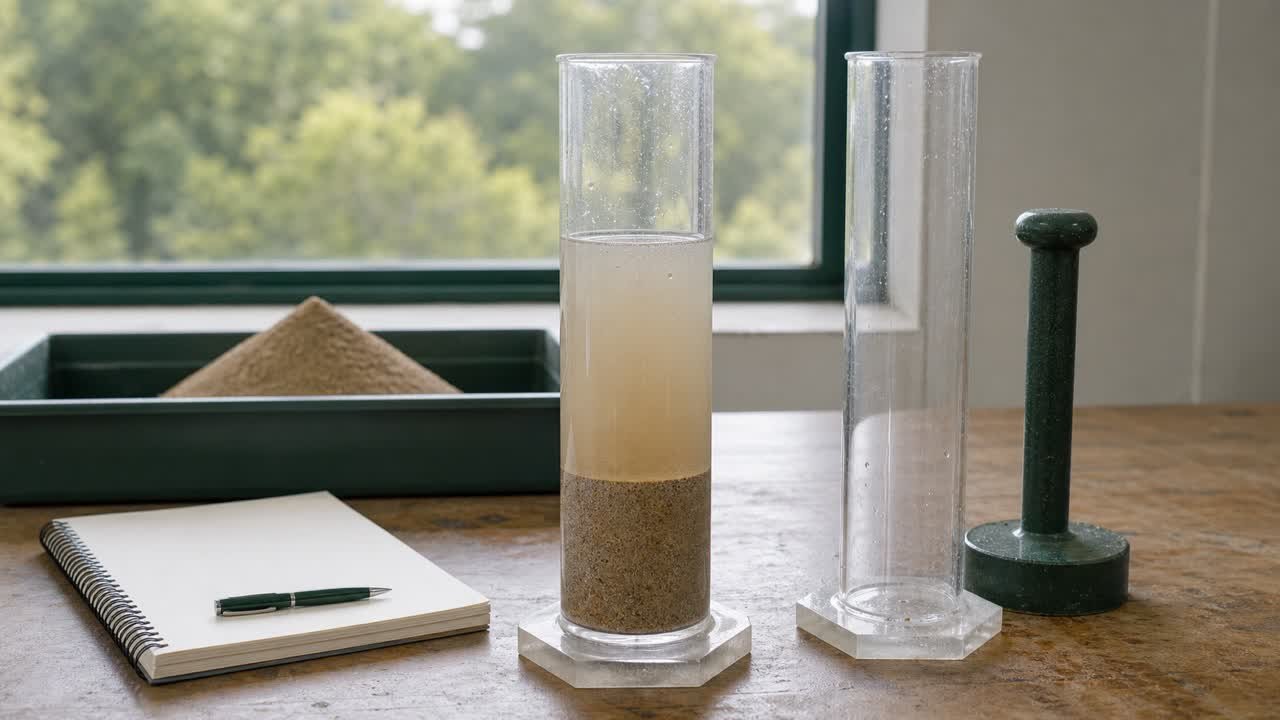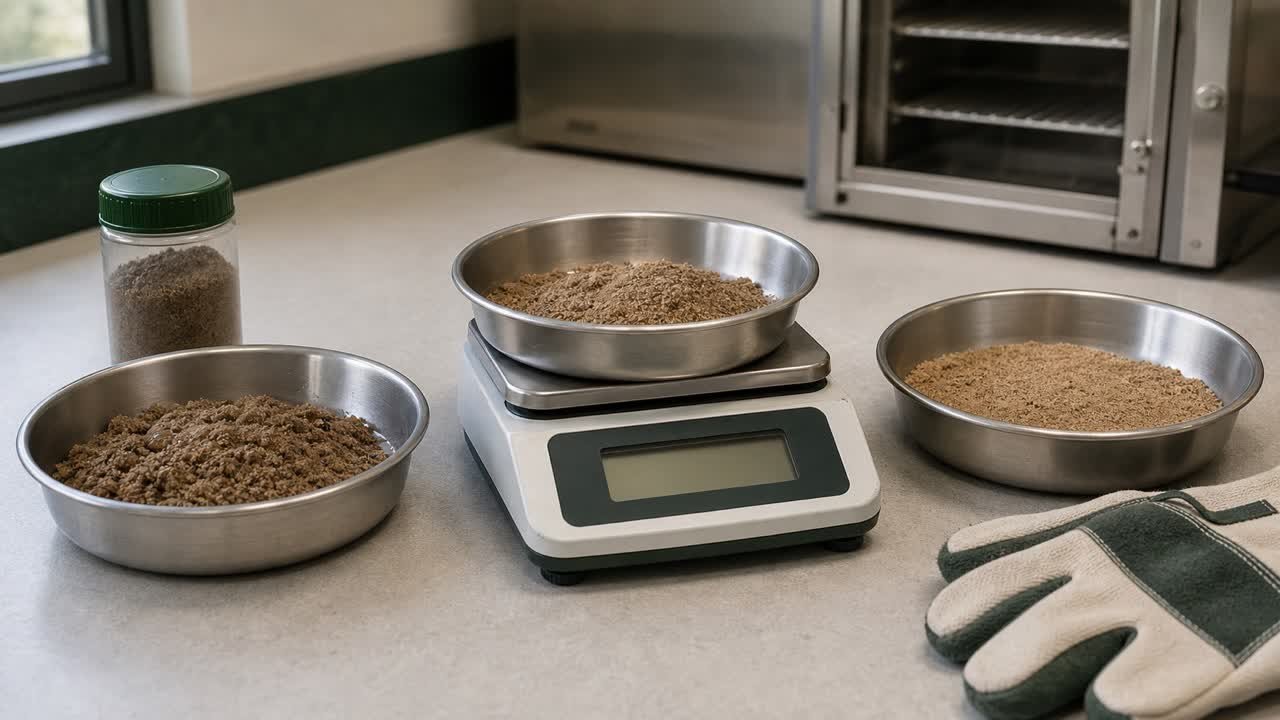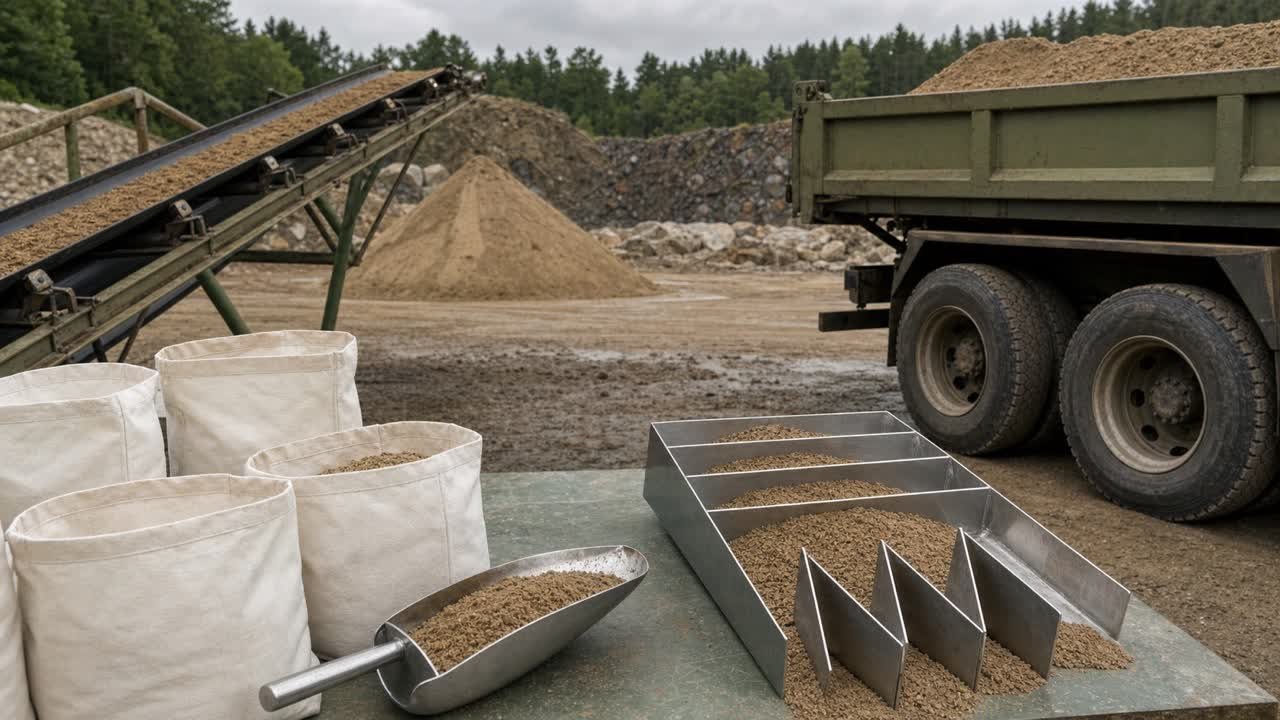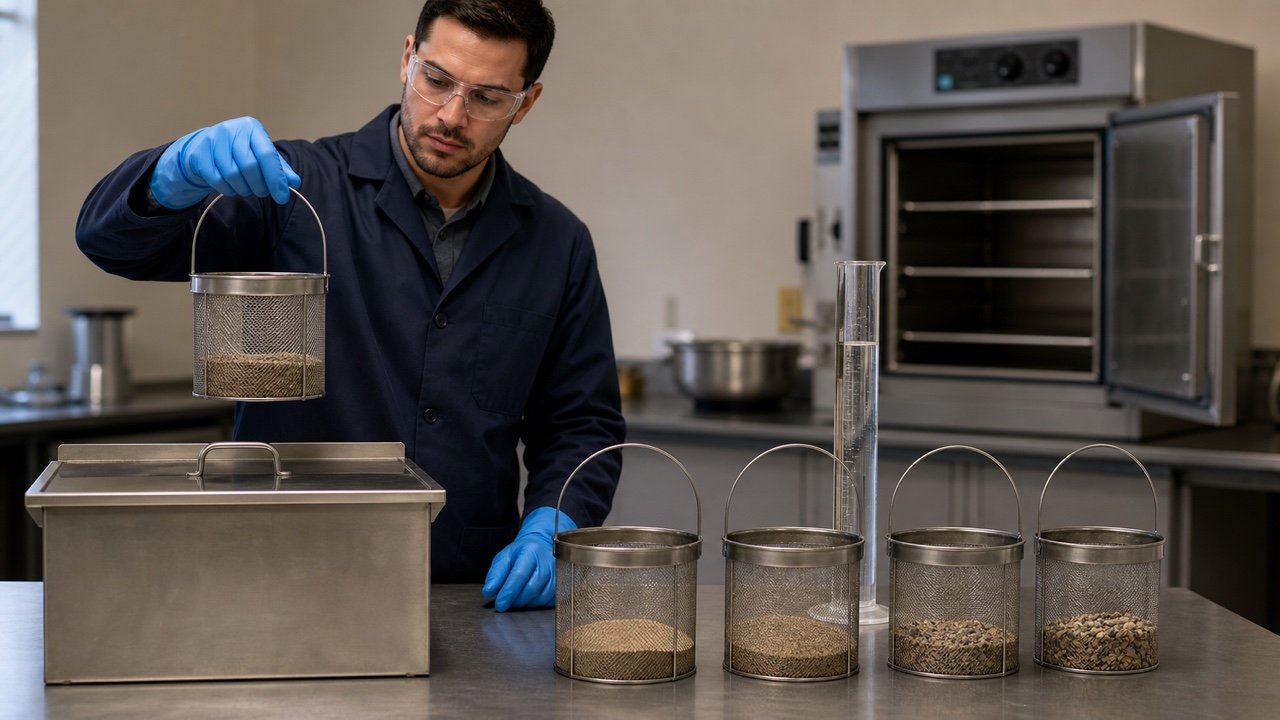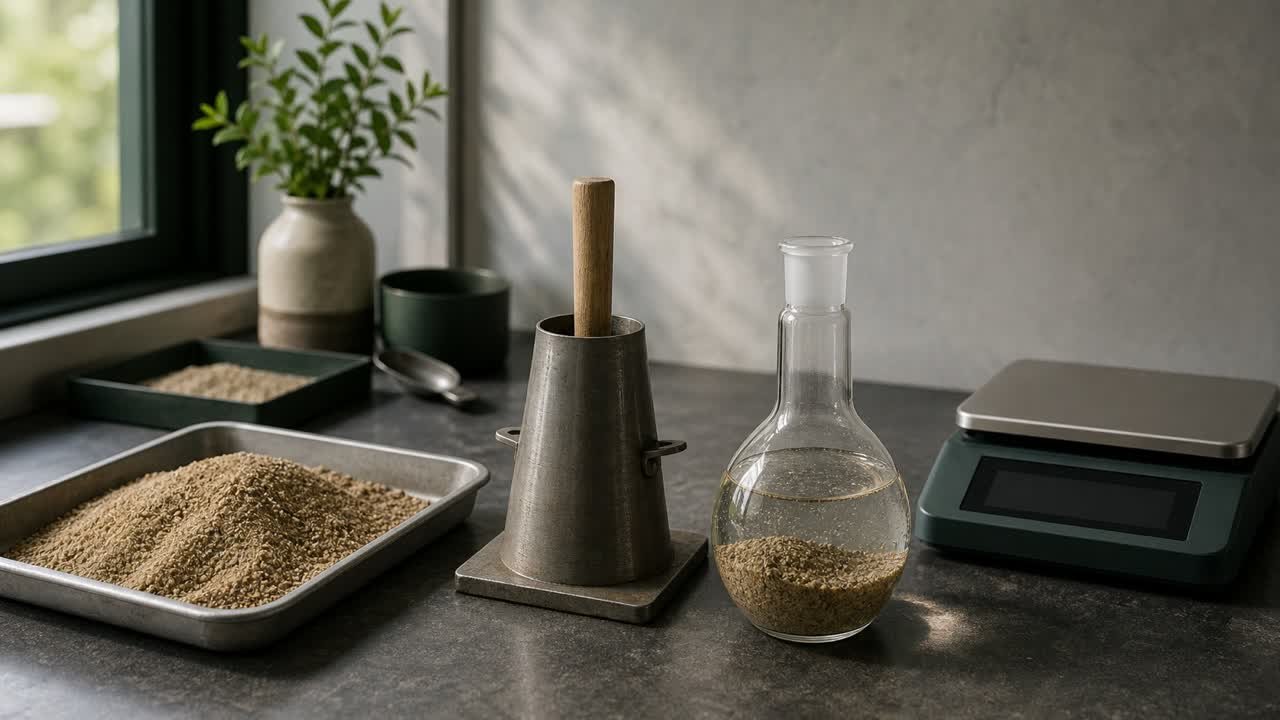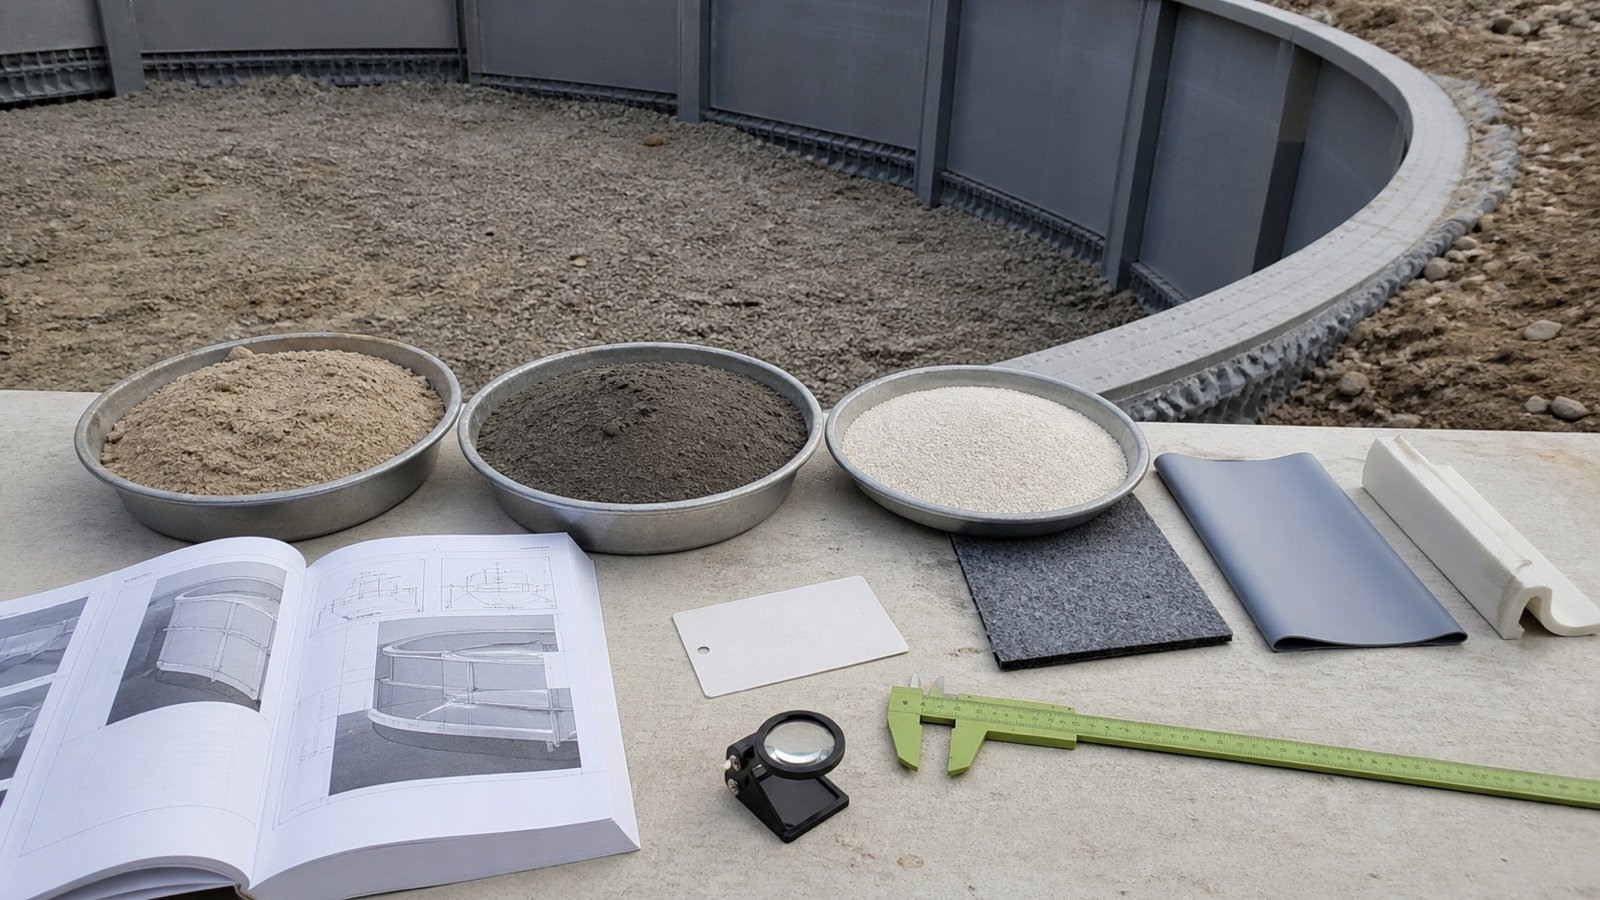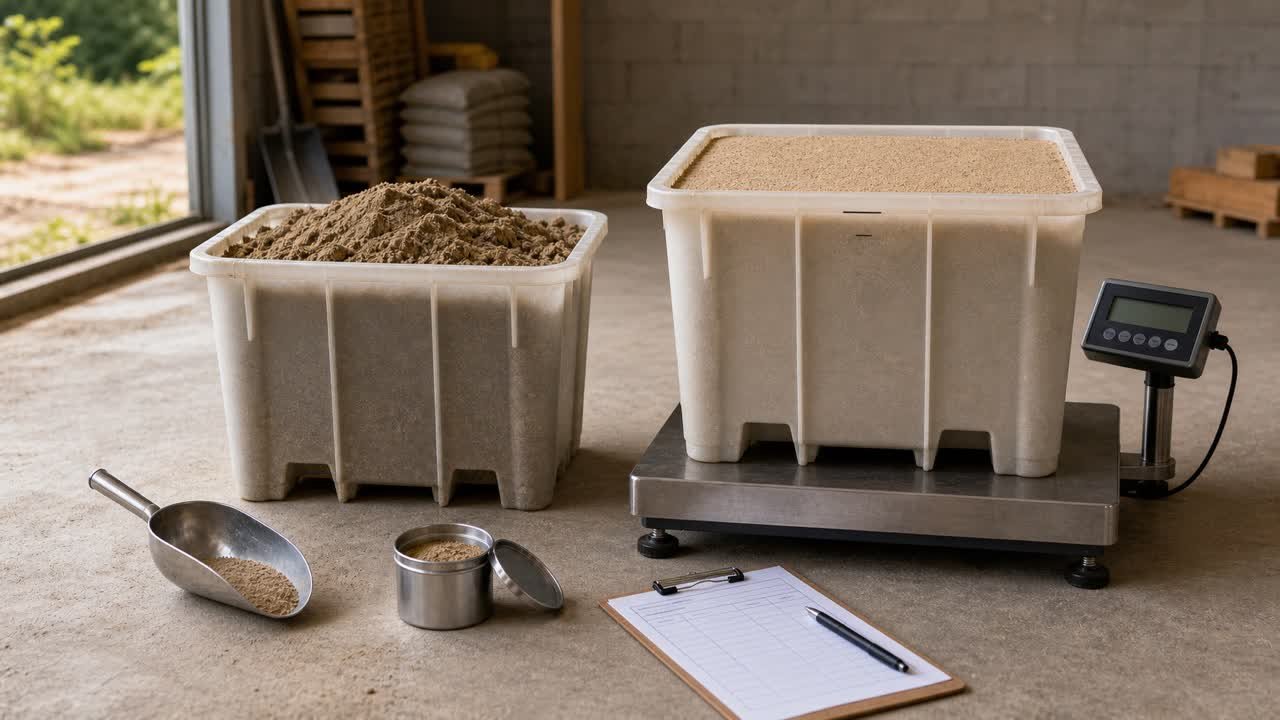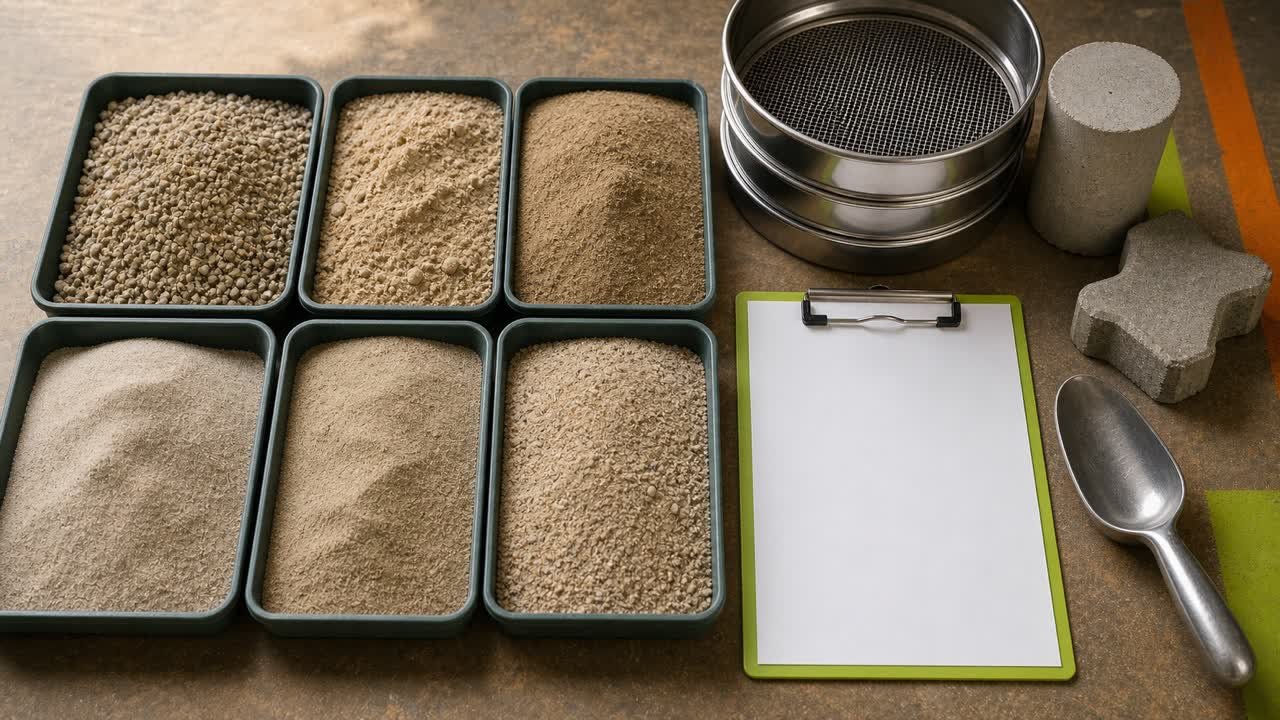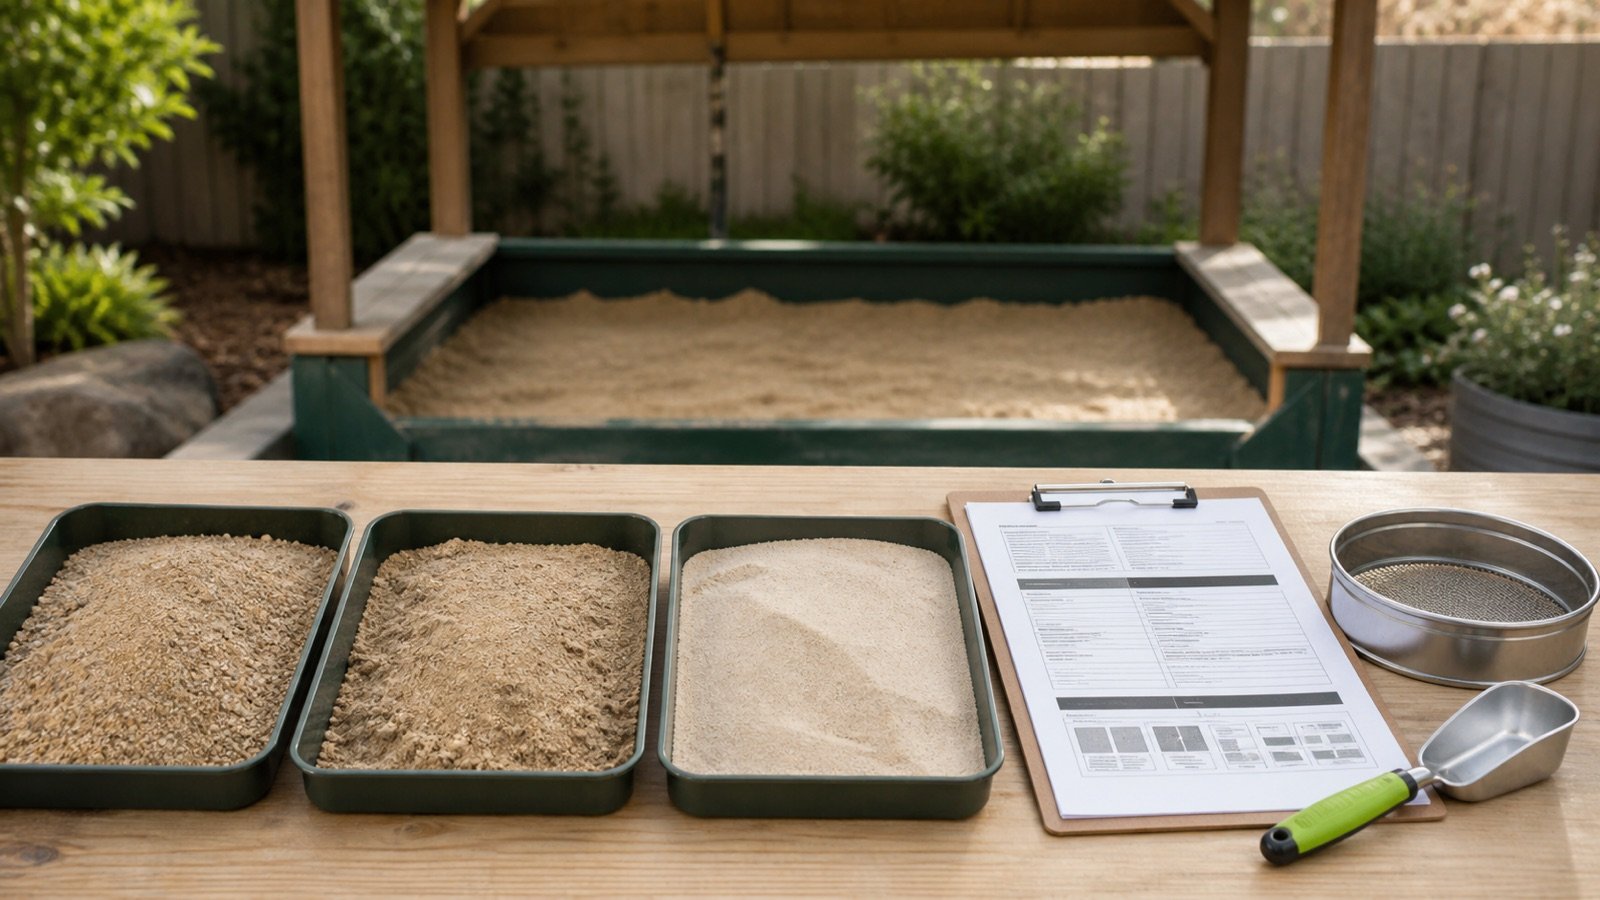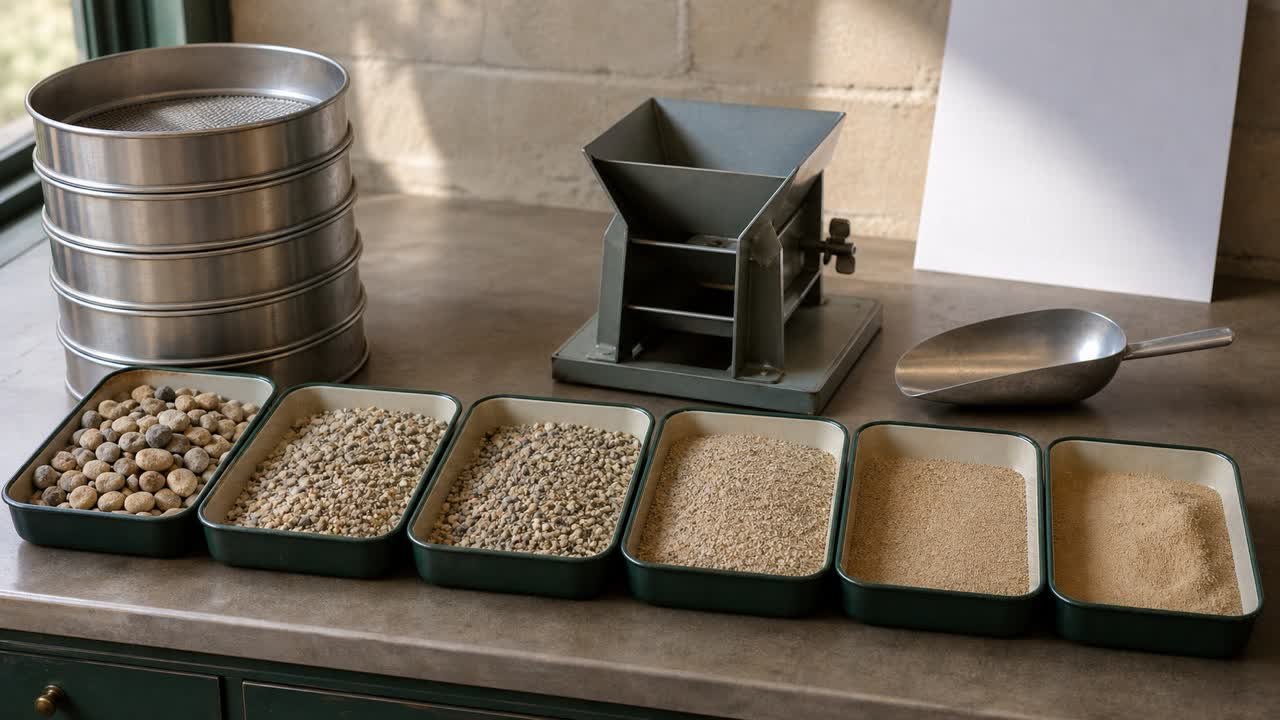
A sand sieve analysis report turns a test specimen into a particle-size distribution. The useful reading starts with the sample identity and test method, then checks the mass calculations before comparing the result with a project specification.
A pass label alone cannot show whether the report belongs to your delivery, uses the required method, or covers every property the project controls. Keep the report, specification, sample record, and delivery record together.
What does a sand sieve analysis show?
A sand sieve analysis shows how much of a dry test specimen passes or remains on each stated sieve opening. The result is a mass-based gradation table, often paired with a curve that plots percent passing against particle size.
The test reports particle-size distribution for the sampled material. It can support product identification, mix control, specification checks, and quality records when the sample, method, limits, and acceptance rules all match the project.
Record the material, source, stockpile or lot, sample location, sample date, test date, laboratory, method designation, method revision, and project specification before reading the percentages.
Which report details should you confirm first?
Confirm 6 items before using the numeric result. Missing identity or method information can make correct arithmetic unusable for a project decision.
- Material and source: product description, supplier, plant or pit, and any approved material code.
- Sample connection: lot, stockpile, delivery, location, sampler, and date.
- Test specimen: total dry mass and any split or composite preparation.
- Method: exact test designation, revision, and whether washing was required before dry sieving.
- Specification: project document, table, class, application, edition, and any permitted tolerances.
- Review status: test date, report date, laboratory identity, checker or verifier, and stated compliance status.
A current California Department of Transportation DIME report example shows why these fields matter. It records the test method, sample mass, sieve results, dates, organization, material type, and compliance field for one identified sample.
How are percent retained and percent passing calculated?
Percent retained uses the mass caught on one sieve divided by the original dry test mass. Cumulative retained adds that sieve's percentage to every larger sieve above it. Percent passing is 100 minus cumulative percent retained.
Percent retained = mass retained on the sieve ÷ total dry sample mass × 100
Cumulative percent retained = running sum from the largest sieve to the current sieve
Percent passing = 100 − cumulative percent retained
TxDOT Tex-401-A uses the original dry sample mass as the percentage basis and requires individual retained masses when percent passing is needed. California Test 202 gives the same passing relationship from cumulative retained results.
What should the columns do down the table?
As sieve openings get smaller, cumulative retained should stay the same or increase. Percent passing should stay the same or decrease. A reversal points to a transcription, sequence, formula, or rounding problem that needs checking.
| Column | Meaning | Expected direction down the sieve stack |
|---|---|---|
| Mass retained | Mass caught on one sieve | May rise or fall |
| Percent retained | One sieve's share of the total dry mass | May rise or fall |
| Cumulative retained | Total share caught on that sieve and all larger sieves | Same or higher |
| Percent passing | Share finer than the current opening | Same or lower |
Worked example: 500 g sand sieve analysis
This independent example uses a 500.0 g dry specimen. The retained masses sum to the stated test mass, so every percentage can be checked from the same denominator.
| Sieve | Opening | Mass retained | Percent retained | Cumulative retained | Percent passing |
|---|---|---|---|---|---|
| No. 4 | 4.75 mm | 0 g | 0% | 0% | 100% |
| No. 8 | 2.36 mm | 25 g | 5% | 5% | 95% |
| No. 16 | 1.18 mm | 70 g | 14% | 19% | 81% |
| No. 30 | 0.600 mm | 135 g | 27% | 46% | 54% |
| No. 50 | 0.300 mm | 145 g | 29% | 75% | 25% |
| No. 100 | 0.150 mm | 95 g | 19% | 94% | 6% |
| No. 200 | 0.075 mm | 20 g | 4% | 98% | 2% |
| Pan | Below last sieve | 10 g | 2% | 100% | 0% |
Check one row. The 70 g on the No. 16 sieve is 70 ÷ 500 × 100 = 14%. Add 0%, 5%, and 14% to get 19% cumulative retained. Subtract 19% from 100% to get 81% passing.
The mass check is 0 + 25 + 70 + 135 + 145 + 95 + 20 + 10 = 500 g. A real laboratory applies the balance, sample, sieve-loading, loss, and rounding requirements in its governing method. This example does not create a universal mass-loss tolerance.
How do you audit a sieve analysis table?
Repeat the checks in a fixed order. This separates an arithmetic issue from a sampling, method, or specification issue.
- Add all individual retained masses and compare the sum with the report's original dry mass.
- Confirm that every percentage uses the same stated dry-mass denominator.
- Recalculate at least 2 percent-retained rows.
- Add the retained percentages cumulatively from the largest opening downward.
- Confirm that percent passing equals 100 minus cumulative retained on each row.
- Check that percent passing never rises as the openings get smaller.
- Confirm that the listed sieves, washing step, reporting precision, and calculation basis match the named method.
- Compare the result only with the correct project band, class, and edition.
Keep original precision during a reconstruction. Reported whole percentages may create small apparent differences when rounded rows are added. Use retained masses and the method's rounding rule when those values are available.
How do you read a sand gradation curve?
A gradation curve plots sieve opening on the horizontal axis and percent passing on the vertical axis. Read a point by finding the sieve opening, moving to the sample curve, and reading the passing percentage.
The project may show upper and lower limits around the sample curve. Check every controlled sieve. A curve inside one project's envelope does not prove compliance with another project's sand class or application.
Can 2 sands have the same fineness modulus?
Yes. Fineness modulus compresses several cumulative retained values into one index. Different distributions can produce the same sum, so compare the full sieve table and curve when individual size fractions matter.
How is sand fineness modulus calculated?
Fineness modulus is the sum of cumulative percent retained on a specified sieve series divided by 100. Name the sieve series and method with the value because different scopes or specifications may use different details.
FM = sum of cumulative percent retained on the specified sieves ÷ 100
For the 500 g example, use cumulative retained on No. 4, 8, 16, 30, 50, and 100:
FM = (0 + 5 + 19 + 46 + 75 + 94) ÷ 100 = 2.39
Iowa DOT IM 302 describes this cumulative-retained calculation and its reporting rules. FM is an index of relative fineness for the stated series. Use project requirements to decide whether the value is acceptable and how it affects a mix or product.
Why can washing change the No. 200 result?
Fine particles can cling to larger grains or form small agglomerations during dry sieving. A governing method may require washing to separate material finer than the 0.075 mm No. 200 sieve before the remaining specimen is dried and sieved.
FHWA Protocol P51 states that material finer than the No. 200 sieve is separated more completely by wet sieving when accurate fines determination is required. Its washed amount and dry-sieved amount are included in the reported result under that protocol.
Check whether the report says dry sieve, washed sieve, or a combined result. Do not substitute a dry-only value when the project requires a washing method.
Does a passing sample approve the full delivery?
A sample result applies through the project's sampling and acceptance rules. Connect it to the correct lot, stockpile, production period, delivery tickets, sample location, and chain of custody before extending the result beyond the tested specimen.
Stockpiles can segregate during production, handling, loading, and placement. A single report also has a date and source. Ask the project reviewer which quantity or time period the sample represents and what retesting, verification, or rejection rules apply.
| Decision | Required evidence | What sieve analysis contributes |
|---|---|---|
| Check the arithmetic | Dry mass, retained masses, sieve sequence, calculation and rounding rule | Retained, cumulative retained, and passing values |
| Check gradation compliance | Correct project specification, class, edition, limits, and acceptance rule | Sample result for comparison |
| Apply the result to material | Sample location, lot, stockpile, production and delivery traceability | Tested specimen identity |
| Judge other properties | Applicable tests and project criteria for each property | Particle-size distribution only |
What does sieve analysis leave unproven?
Gradation alone does not establish bulk density, moisture content, particle shape, angularity, cleanliness, organic impurities, plasticity, absorption, durability, strength, compaction response, drainage performance, or suitability for every construction use.
The FHWA soil and rock properties reference separates mechanical sieve analysis for sand and coarser material from hydrometer testing for finer fractions. It also lists separate aggregate tests for properties such as absorption, angularity, and sand equivalent in the stated pavement and geotechnical context.
Use the governing specification to identify every required property and test. The construction sand selection guide explains why a supplier name or appearance cannot replace product records and project requirements.
Questions to send with a sand report
- Which material, source, stockpile, lot, and delivery does this sample represent?
- Who collected the sample, where, when, and under which sampling method?
- Which sieve-analysis method and revision did the laboratory use?
- Was material finer than the No. 200 sieve measured by washing, dry sieving, or a stated combination?
- What original dry mass and retained masses support the percentages?
- Which project specification, sand class, table, edition, and acceptance rule were applied?
- Does the report cover one specimen, a lot average, a verification sample, or another acceptance unit?
- Which other tests control the product's intended use?
Common sieve-analysis mistakes
- Reading percent retained as percent passing.
- Calculating passing from individual retained instead of cumulative retained.
- Starting the cumulative total in the middle of the sieve stack.
- Mixing sieve numbers, opening sizes, or national series without checking the report.
- Ignoring a retained-mass sum that does not reconcile with the stated test mass.
- Comparing a dry-only No. 200 result with a requirement based on washing.
- Calculating FM from the wrong sieves or treating FM as a full gradation curve.
- Applying a specification band from another material, application, edition, or jurisdiction.
- Using one sample report for an unidentified delivery or stockpile.
- Treating gradation as proof of density, moisture, strength, drainage, or compaction.
Once the product and required layer depth are confirmed, use the Sand Calculator for geometric volume, supplier-density mass, or documented package yield. Return to the Sand material planning hub for coverage, weight, selection, moisture, and ordering guides.
Sources and source scope
- FHWA Protocol P51, Test Method for Sieve Analysis of Subgrade Soils: washed and dry sieve procedure, 0.075 mm No. 200 boundary, drying, and calculation context in the stated LTPP protocol.
- TxDOT Tex-401-A, Sieve Analysis of Fine and Coarse Aggregate: retained-mass procedure, percent-retained formula, dry-mass denominator, and reporting context.
- California Test 202: cumulative retained and percent-passing calculation and composite-sample context.
- Iowa DOT IM 302: percent-passing reporting and fineness-modulus calculation.
- FHWA Chapter 5, Evaluation of Soil and Rock Properties: sieve and finer-particle test boundaries plus separate aggregate-property tests.
- California DOT DIME fine-aggregate report example: sample, method, laboratory, date, mass, passing, and compliance record fields for one reported test.
Scope: this page explains report arithmetic and review questions. The governing project documents, current test method, sampling plan, laboratory procedures, acceptance rules, and responsible qualified people control testing and material approval.
BuildQuantities.com records its research and calculation checks on the methodology page. Report a formula, source, unit, or rendering problem through the corrections route.